Wednesday, June 18, 2014

How to enable unicast on Ganglia

To configure unicast you should designate one machine to be receiver. Receiver's gmond.conf should look like this

globals {
  daemonize = yes
  setuid = yes
  user = nobody
  debug_level = 0
  max_udp_msg_len = 1472
  mute = no
  deaf = no
  allow_extra_data = yes
  host_dmax = 86400 /* Remove host from UI after it hasn't report for a day */
  cleanup_threshold = 300 /*secs */
  gexec = no
  send_metadata_interval = 30 /*secs */
}

cluster {
  name = "Production"
  owner = "unspecified"
  latlong = "unspecified"
  url = "unspecified"
}

host {
  location = "unspecified"
}

udp_send_channel {
  host = ip.add.ress.here
  port = 8649
  ttl = 1
}
udp_recv_channel { 
  port = 8649
}

tcp_accept_channel {
  port = 8649
}
 
.....
 
On all the other machines you will need to configure only this
globals {
  daemonize = yes
  setuid = yes
  user = nobody
  debug_level = 0
  max_udp_msg_len = 1472
  mute = no
  deaf = yes
  allow_extra_data = yes
  host_dmax = 86400 /* Remove host from UI after it hasn't report for a day */
  cleanup_threshold = 300 /*secs */
  gexec = no
  send_metadata_interval = 30 /*secs */
}

cluster {
  name = "Production"
  owner = "unspecified"
  latlong = "unspecified"
  url = "unspecified"
}

host {
  location = "unspecified"
}

udp_send_channel {
  host = ip.add.ress.here
  port = 8649
  ttl = 1
}
...
 
Please notice that send_metadata_interval is set to 30 (seconds). Metrics in Ganglia are sent separately from it's metadata. Metadata contains information like metric group, type etc. In case you restart receiving gmond metadata will be lost and gmond will not know what to do with the metric data and it will be discarded. This may result in blank graphs. In multicast mode gmonds can talk to each other and will ask for metadata if it's missing. This is not possible in unicast mode thus you need to instruct gmond to periodically send metadata.

Now in your gmetad.conf put
# /etc/gmetad.conf on ip.add.ress.here
data_source "Production" ip.add.ress.here
...
 
Now restart everything...

Tuesday, June 10, 2014

CSS!!!

Pretty cool

http://css3please.com/

Nagios Set up


How To Install Nagios On CentOS 6

Step 1 - Install Packages on Monitoring Server

rpm -Uvh http://dl.fedoraproject.org/pub/epel/6/x86_64/epel-release-6-8.noarch.rpm
rpm -Uvh http://rpms.famillecollet.com/enterprise/remi-release-6.rpm
yum -y install nagios nagios-plugins-all nagios-plugins-nrpe nrpe php httpd
chkconfig httpd on && chkconfig nagios on
service httpd start && service nagios start


We should also enable SWAP memory on this droplet, at least 2GB:

dd if=/dev/zero of=/swap bs=1024 count=2097152
mkswap /swap && chown root. /swap && chmod 0600 /swap && swapon /swap
echo /swap swap swap defaults 0 0 >> /etc/fstab
echo vm.swappiness = 0 >> /etc/sysctl.conf && sysctl -p


Step 2 - Set Password Protection


Set Nagios Admin Panel Password:
htpasswd -c /etc/nagios/passwd nagiosadmin


Make sure to keep this username as "nagiosadmin" - otherwise you would have to change /etc/nagios/cgi.cfg and redefine authorized admin.

Now you can navigate over to your droplet's IP address http://IP/nagios and login.

You will be prompted for password you set in Step 2:


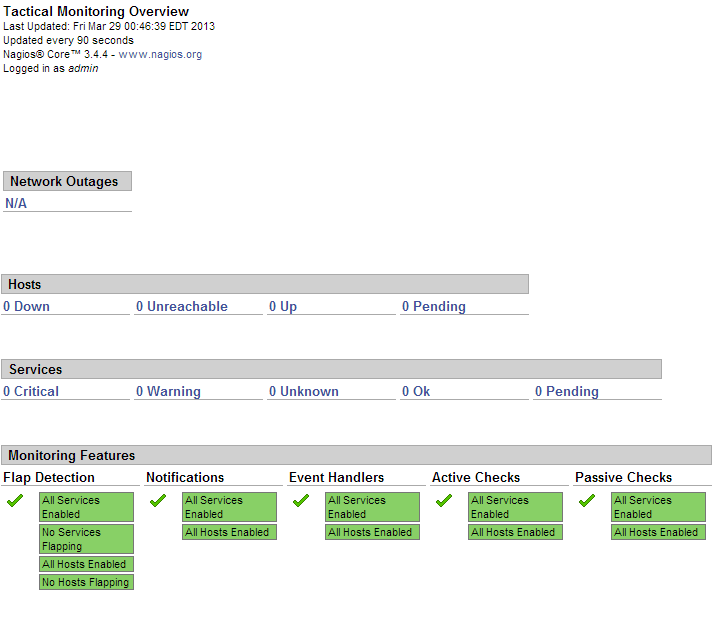
This is what the Nagios admin panel looks like:


Since this is a fresh installation, we don't have any hosts currently being monitored.


Now we should add our hosts that will be monitored by Nagios. For example, we will use cloudmail.tk (198.211.107.218) and emailocean.tk (198.211.112.99).

From public ports, we can monitor ping, any open ports such as webserver, e-mail server, etc.

For internal services that are listening on localhost, such as MySQL, memcached, system services, we will need to use NRPE.

Step 4 - Install NRPE on Clients


rpm -Uvh http://dl.fedoraproject.org/pub/epel/6/x86_64/epel-release-6-8.noarch.rpm
rpm -Uvh http://rpms.famillecollet.com/enterprise/remi-release-6.rpm
yum -y install nagios nagios-plugins-all nrpe
chkconfig nrpe on


This next step is where you get to specify any manual commands that Monitoring server can send via NRPE to these client hosts.

Make sure to change allowed_hosts to your own values.

Edit /etc/nagios/nrpe.cfg

log_facility=daemon
pid_file=/var/run/nrpe/nrpe.pid
server_port=5666
nrpe_user=nrpe
nrpe_group=nrpe
allowed_hosts=198.211.117.251
dont_blame_nrpe=1
debug=0
command_timeout=60
connection_timeout=300
include_dir=/etc/nrpe.d/
command[check_users]=/usr/lib64/nagios/plugins/check_users -w 5 -c 10
command[check_load]=/usr/lib64/nagios/plugins/check_load -w 15,10,5 -c 30,25,20
command[check_disk]=/usr/lib64/nagios/plugins/check_disk -w 20% -c 10% -p /dev/vda
command[check_zombie_procs]=/usr/lib64/nagios/plugins/check_procs -w 5 -c 10 -s Z
command[check_total_procs]=/usr/lib64/nagios/plugins/check_procs -w 150 -c 200
command[check_procs]=/usr/lib64/nagios/plugins/check_procs -w $ARG1$ -c $ARG2$ -s $ARG3$


Note:

In check_disk above, the partition being checked is /dev/vda - make sure your droplet has the same partition by running df -h /

You can also modify when to trigger warnings or critical alerts - above configuration sets Warning at 20% free disk space remaining, and Critical alert at 10% free space remaining.


We should also setup firewall rules to allow connections from our Monitoring server to those clients and drop everyone else:

iptables -N NRPE
iptables -I INPUT -s 0/0 -p tcp --dport 5666 -j NRPE
iptables -I NRPE -s 198.211.117.251 -j ACCEPT
iptables -A NRPE -s 0/0 -j DROP
/etc/init.d/iptables save


Now you can start NRPE on all of your client hosts:
service nrpe start


Step 5 - Add Server Configurations on Monitoring Server


Back on our Monitoring server, we will have to create config files for each of our client servers:
echo "cfg_dir=/etc/nagios/servers" >> /etc/nagios/nagios.cfg
cd /etc/nagios/servers
touch cloudmail.tk.cfg
touch emailocean.tk.cfg


Edit each client's configuration file and define which services you would like monitored.

nano /etc/nagios/servers/cloudmail.tk.cfg


Add the following lines:

define host {
        use                     linux-server
        host_name               cloudmail.tk
        alias                   cloudmail.tk
        address                 198.211.107.218
        }

define service {
        use                             generic-service
        host_name                       cloudmail.tk
        service_description             PING
        check_command                   check_ping!100.0,20%!500.0,60%
        }

define service {
        use                             generic-service
        host_name                       cloudmail.tk
        service_description             SSH
        check_command                   check_ssh
        notifications_enabled           0
        }

define service {
        use                             generic-service
        host_name                       cloudmail.tk
        service_description             Current Load
        check_command                   check_local_load!5.0,4.0,3.0!10.0,6.0,4.0
        }
You can add more services to be monitored as desired. Same configuration should be added for second client, emailocean.tk, with different IP address and host_name:

This is a snippet of /etc/nagios/servers/emailocean.tk.cfg:
define host {
        use                     linux-server
        host_name               emailocean.tk
        alias                   emailocean.tk
        address                 198.211.112.99
        }

...


You can add additional clients to be monitored as /etc/nagios/servers/AnotherHostName.cfg

Finally, after you are done adding all the client configurations, you should set folder permissions correctly and restart Nagios on your Monitoring Server:

chown -R nagios. /etc/nagios
service nagios restart


Step 6 - Monitor Hosts in Nagios


Navigate over to your Monitoring Server's IP address http://IP/nagios and enter password set in Step 2.

Now you should be able to see all the hosts and services:


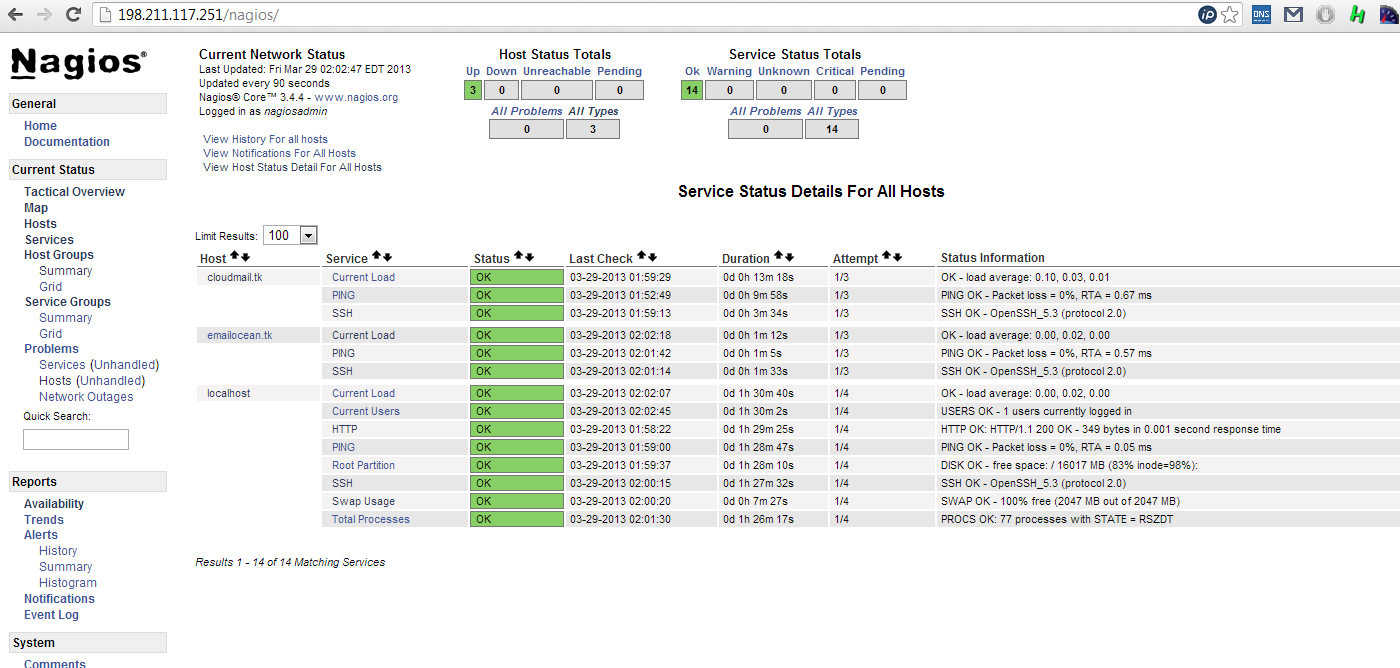
And you are all done! 
---------------- EXAMPLE -------------
rpm -Uvh http://dl.fedoraproject.org/pub/epel/6/x86_64/epel-release-6-8.noarch.rpm

rpm -Uvh http://rpms.famillecollet.com/enterprise/remi-release-6.rpm

yum -y install nagios nagios-plugins-all nrpe

chkconfig nrpe on

vim /etc/nagios/nrpe.cfg

        allowed_hosts=<ip_address>

service nrpe start


--------------------------------- SERVER -------------------------

rpm -Uvh http://dl.fedoraproject.org/pub/epel/6/x86_64/epel-release-6-8.noarch.rpm

rpm -Uvh http://rpms.famillecollet.com/enterprise/remi-release-6.rpm

yum -y install nagios nagios-plugins-all nagios-plugins-nrpe nrpe php httpd

chkconfig httpd on && chkconfig nagios on

service httpd status/start

service nagios start

htpasswd -c /etc/nagios/passwd nagiosadmin

vim /etc/nagios/nrpe.cfg

service nrpe start

echo "cfg_dir=/etc/nagios/servers" >> /etc/nagios/nagios.cfg

cd /etc/nagios/

mkdir servers

cd servers/

touch 113.tk.cfg

vim 113.tk.cfg

chown -R nagios. /etc/nagios

service nagios restart

Ganglia set up notes

To install additional package
rpm -Uvh http://dl.fedoraproject.org/pub/epel/6/x86_64/epel-release-6-8.noarch.rpm

To install software on client
Install--> yum install ganglia ganglia-gmond
Modify-->  vim /etc/ganglia/gmond.conf
Start--> service gmond restart

To install software on server
yum install ganglia ganglia-gmetad ganglia-web ganglia-gmond
(ganglia-web is for web. Ganglia runs in Apache Webserver. It has php front-end. The message transfer in UDP (unified data protocol) XML.)

Edit /etc/ganglia/gmetad.conf to specify what is being collected and from where

Edit /etc/ganglia/gmond.conf to specify cluster information, etc

Edit /etc/httpd/conf.d/ganglia.conf to Allow from all

Stop iptables
/etc/init.d/iptables stop

In order to get it running, start service /etc/init.d/gmond, gmetad, httpd

If you receive following message: You can edit /etc/httpd/conf/httpd.conf to specify
#ServerName www.example.com:80 (See https://www.centos.org/forums/viewtopic.php?t=3063#p191141 and http://forums.fedoraforum.org/showpost.php?s=93715a43af9e01e59afb4d18208ed200&p=1245069&postcount=6)

Perhaps you can also try this
http://myconfigure.blogspot.com/2013/03/httpd-aprsockaddrinfoget-failed-for.html
http://www.adminsehow.com/2011/03/how-to-fix-starting-httpd-httpd-apr_sockaddr_info_get-failed/

[root@machine~]# /etc/init.d/httpd restart
Stopping httpd:                                            [  OK  ]
Starting httpd: httpd: apr_sockaddr_info_get() failed for machine
httpd: Could not reliably determine the server's fully qualified domain name, using 127.0.0.1 for ServerName                                           [  OK  ]
 

If you receive following error when trying to view webpage: http://machine/ganglia/
you need to disable selinux. Edit vim /etc/sysconfig/selinux to specify
# This file controls the state of SELinux on the system.
# SELINUX= can take one of these three values:
#       enforcing - SELinux security policy is enforced.
#       permissive - SELinux prints warnings instead of enforcing.
#       disabled - SELinux is fully disabled.
SELINUX=disabled
# SELINUXTYPE= type of policy in use. Possible values are:
#       targeted - Only targeted network daemons are protected.
#       strict - Full SELinux protection.
SELINUXTYPE=targeted

# SETLOCALDEFS= Check local definition changes
SETLOCALDEFS=0


(Reference: http://sourceforge.net/p/ganglia/mailman/ganglia-general/thread/1340954951.77006.YahooMailNeo@web112806.mail.gq1.yahoo.com/)

More on how to disable SELINUX
http://www.crypt.gen.nz/selinux/disable_selinux.html
https://www.centos.org/docs/5/html/5.1/Deployment_Guide/sec-sel-enable-disable.html

There was an error collecting ganglia data (127.0.0.1:8652): fsockopen error: Permission denied

If that does not work, try
chown -R nobody:root /var/lib/ganglia/rrds 
(Reference: http://viewsby.wordpress.com/2013/03/12/ganglia-error-collecting-data-127-0-0-18652-fsockopen-error-connection-refused/)
 
Also, this might be due to permissions: http://mon.iihe.ac.be/trac/t2b/ticket/39 
 
WOOT!!!! 
if disabling selinux is not an option :

# setsebool -P httpd_can_network_connect 1
 
Reference: https://www.mail-archive.com/ganglia-general@lists.sourceforge.net/msg03748.html
 

Refer to tail -500f /var/log/messages for any possible errors

Run gmetad -d 2 to debug gmetad

Hostname can be specified here: /etc/sysconfig/network

You can use curl command to see the output of the webpage on the same server. this can be helpful if trying to determine if firewall, etc is the issue
curl http://machine/ganglia/

Helpful notes on how to validate and test
http://sachinsharm.wordpress.com/2013/08/17/setup-and-configure-ganglia-3-6-on-centosrhel-6-3/

References: 
How to install Ganglia
http://gubendran.blogspot.com/2013/02/about-ganglia-and-steps-to-install-in.html 
http://acidborg.wordpress.com/2010/10/08/how-to-install-and-configure-ganglia-on-red-hat-enterprise-linux-5/ 
http://unixbhaskar.wordpress.com/2011/05/09/ganglia-installation-on-centos/
http://sourceforge.net/apps/trac/ganglia/wiki/ganglia_quick_start

http://www.slashroot.in/how-install-and-configure-ganglia-gmod-and-ganglia-gmetad


How to restart Ganglia on nodes

Server:
[root@server ~]# /etc/init.d/gmetad restart
Shutting down GANGLIA gmetad:                              [  OK  ]
Starting GANGLIA gmetad:                                   [  OK  ]
[root@server ~]# /etc/init.d/gmond restart
Shutting down GANGLIA gmond:                               [  OK  ]
Starting GANGLIA gmond:                                    [  OK  ]
[root@server ~]#  /etc/init.d/httpd stop
Stopping httpd:                                            [  OK  ]
[root@server ~]# /etc/init.d/httpd start
Starting httpd:                                            [  OK  ]


On each client
[root@client ~]# service gmond restart

How do I fix “missing Codebase, Permissions, and Application-Name manifest attribute” in my JNLP app?

(1) First, you need to create a text file with all of the attributes you want to add. My text file looks like this:
Permissions: all-permissions
Codebase: http://www.codebase.com/myApp/dist
Application-Name: My Application
I named it addToManifest.txt. Obviously, you'll need to change the parameters to match your application's needs.

(2) Next, you need to add this to the main .jar and all of the libraries as well. The command to do this is:
jar ufm dist\myApp.jar addToManifest.txt
of course dist\myApp.jar will need to point to whatever your main .jar is. You'll also need to do this for all of the libraries as well.
jar ufm dist\lib\jcommon-1.0.16.jar addToManifest.txt
jar ufm dist\lib\jfreechart-1.0.13.jar addToManifest.txt
jar ufm dist\lib\joda-time-2.2.jar addToManifest.txt
...
(Note: on Windows, I wrote a .bat file for this.)
Once you do this, the attributes should be written to the .jars. You can open the .jars in a zip manager (like 7-Zip), extract the MANIFEST.MF file, open it in a text editor, and you should see the attributes listed.

(3) After adding the attributes, you need to resign your app. The command to do that is:
jarsigner dist\myApp.jar -keystore "C:\myApp\KEYSTORE.ks" alias -storepass password

You'll also need to do this for all of your libraries as well:
jarsigner dist\lib\jcommon-1.0.16.jar -keystore "C:\myApp\KEYSTORE.ks" alias -storepass password
jarsigner dist\lib\jfreechart-1.0.13.jar -keystore "C:\myApp\KEYSTORE.ks" alias -storepass password
jarsigner dist\lib\joda-time-2.2.jar -keystore "C:\myApp\KEYSTORE.ks" alias -storepass password

After that, your attributes should be added and your .jars should be signed!