Thursday, December 18, 2014

Joys of Java 8... as was discovered during maven build that was trying to process wsdl file

Blah!

I was just trying to Clean&Build my work on a different machine and suddenly I had build failure! WTH!?!?

The error stated

Failed to read schema document 'xyz.xsd' because 'file' access is not allowed due to restriction set by the accessExternalSchema property

Never seen this one before and I was trying to figure out if I could not read checked out from git files for some reason. After few tweaks here and there, same issue. So I tried to google this error and I hit many Java 8 issues precessing wsdl, etc posts. Indeed my old machine was running Java 7, while new one was running 8!

On my Mac the solution was pretty easy

Go to 

cd /Library/Java/JavaVirtualMachines/jdk1.8.0_11.jdk/Contents/Home/jre/lib/

And create file jaxp.properties

And add this line to it
javax.xml.accessExternalSchema = all


Wow... oh well :)

Saturday, November 22, 2014

Network & sharing in VirtualBox - Full tutorial

Disclaimer: This post was not made by me, I just wanted to "back up" essential to me parts here in case original went down. You can find the original at http://www.dedoimedo.com/computers/virtualbox-network-sharing.html

------------

This is the fourth article on VirtualBox management. Today, I'm going to teach you everything you need to know of VirtualBox networking and sharing.

I'm going to show you three different methods of configuring your virtual machines and three different ways of sharing data between the host machine and the virtual machine. After mastering this tutorial, you will know all there is to know about using VirtualBox with fun and confidence. Follow me.


Introduction


For more details, you should read the following articles. They will provide you with the necessary background to following today's material with ease and pleasure:

How to install VirtualBox Guest Additions - Tutorial

VirtualBox 3 is amazing!

VirtualBox 3 Compiz slideshow

DirectX in VirtualBox 3 - Pure joy is here

Likewise, you should read the first three installments of this series:

How to clone disks in VirtualBox - Tutorial

How to add hard disks in VirtualBox - Tutorial

How to expand/shrink disks in VirtualBox - Tutorial

Now, let us begin.

VirtualBox network options

For any of your installed virtual machines, click on Settings > Network. Here the fun begins. This is the default view. Any virtual machine can have up to four network adapters. You can enable them selectively as you see fit. Most people will require just one.

Adapter Type defines the virtualized hardware that VirtualBox will expose to your virtual machine. If you have a problem with one of the Adapter types, you can try another. PCnet-FAST III is the default selection.

You also have PCnet-FAST II for older machines and three types of Intel PRO/1000 cards, including two Server versions, which should be useful for people running VirtualBox in a production environment. For home users, the choice is rather transparent.


The most interesting part is Attached to: section. This category defines how your network adapter will interface with existing physical hardware. Different setups will result in markedly different results.


Network types


We have four options here: NAT (default), Bridged, Internal network, and Host Only. Of course, Not attached is also a type, but not one we can really use, per se.

Network Address Translation (NAT)

NAT means the virtual machines will have private IP addresses that are not routable from outside.

Example: Your host is 192.168.1.1. The VirtualBox NAT device will be marked as 10.0.2.1. Therefore, the virtual machines will be given any address in the 10.0.2.x range. Since there is nothing to route access to machines in the 10.0.2.x/24 subnet, they will be inaccessible from your host.


This setup is useful when you don't really care what IP addresses your guests have, each one to its own. However, it is not good if you require forwarding or if you need to expose services to the external world. Likewise, this setup is not good for sharing via network access.

Pluses: simplicity & seclusion.

Minuses: no route to virtual machines, no network sharing.

Bridged Adapter

Bridged Adapter means that any virtual machine running will try to obtain an IP address from the same source your currently active, default network address got its IP address. Hence the term bridged, as the two are connected.

Bridged

If you have more than one active network device, you can choose which one you want to bridge with VirtualBox. In our case, we will use the Wireless adapter wlan0.

Example: Your host has leased an address of 192.168.1.100 from the router. The virtual machine leases an address of 192.168.1.103 from the router. The two machines now share the same network and all standard rules apply. For all practical purposes, the virtual machine is another IP address on your LAN.


More closely, the host:


And the guest:


This setup cannot work if your device (switch, router, ISP, etc) does not permit you to lease more than one IP address. Therefore, computers with direct Internet access may not be able to use Bridged networking.

Pluses: Allows flexible management of the network with port forwarding and services enabled. Allows network sharing in the classic way.

Minuses: Might not work with direct Internet access (requires router), more difficult to understand for new users, exposes machines to network with possible security implications.

Host-only Adapter

Host-only Adapter is very interesting. It's very similar to Bridged Adapter, except that is uses a dedicated network device, called vboxnet0, to lease IP addresses.


Your host machine is the de-facto VirtualBox router, with the IP address of 192.168.56.1. The adapter is not in use if there are no virtual machines running with Host-only setup. However, once they come up, this adapter serves IP addresses to the virtual machines, creating an internal LAN, within your own network.

Example: Your host has the IP address of 192.168.56.1. Your virtual machine has the IP address of 192.168.56.101.


More closely, host:

Host

And the guest:


This is quite similar to what VMware Server does. VMware Server has its two virtual adapters called vmnet1 and vmnet8, which are used assign NAT and host-only IP addresses to guests. However, unlike the VirtualBox NAT adapter, VMware Server always bridges the default network device on your hosts and therefore you have direct network access to NAT-ed machines. You don't have this luxury on VirtualBox (yet).

But the addition of vboxnet0 in VirtualBox 3 has significantly simplified network usage in this phenomenal product. If you wish to recall the trouble I've had to deal with in earlier release of VirtualBox, do take a look at my VMGL tutorial. I had to manually configure everything. BTW, you can change the default IP address allocation, if you want.

Very importantly, please note that using the Host-only adapter does not mean your guests will have Internet access. In fact, they won't. vboxnet0 does not have a default gateway. To make vboxnet0 also serve queries outside the local network, you will have to configure it to use another adapter for that, enable forwarding and possible reconfigure your firewall rules. At the end, you will have achieved Bridged networking, so why bother?
Host-only Adapter is useful for creating private networks, where machines need access to one another, but not necessarily outside this subnet.

Pluses: Useful for noisy software testing, penetration testing. Allows classic network sharing via IP address.

Minuses: As difficult to understand as Bridged networking for new users, no Internet access in the virtual machines. May introduce a security risk to other machines on the private network.

Internal network

Internal network is not very interesting, in my opinion. It's similar to Host-only + NAT, except the networking takes place inside the virtual network of guest machines, without any access for the host, plus there is no real NAT. What you get is a private LAN for your guests only, without any access to the external world.


Tuesday, November 18, 2014

Getting Ambari up and running (with Vagrant)


I assume that you already have VirtualBox and Vagrant installed...

Set up


On guest machine, create a folder that would contain files for the VM
mkdir hadoop_ambari

Change to it and issue command to download the VM box and to add it to your library of VMs with specific name.
cd hadoop_ambari
vagrant box add hadoop_ambari https://github.com/2creatives/vagrant-centos/releases/download/v6.5.1/centos65-x86_64-20131205.box

Once download is complete, we can initialize Vagrant, which in turn would create Vagrantfile that acts as a configuration file. Various options are available to be specified: memory, ip, ports, etc.
vagrant init hadoop_ambari

Open Vagrantfile with vi editor and make following changes
config.vm.network :forwarded_port, guest: 8080, host: 8080
config.vm.network "private_network", ip: "192.168.33.10"
config.vm.provider "virtualbox" do |vb|  #
     # Use VBoxManage to customize the VM. For example to change memory:
     vb.customize ["modifyvm", :id, "--memory", "8192"]

end

Here we assigned static ip, opened port 8080 and made sure that we have 8GB of memory allocated to the machine.

Save the file and start vagrant
vagrant up

Once it starts, log in and change to root
vagrant ssh

inside of guest OS
sudo su
cd ~

Find out hostname of the machine
hostname

Edit /etc/hosts file to the following
vi /etc/hosts

192.168.33.11 <hostname>

(this ip was specified as static inside of your Vagrant file)

Install NTP service
yum install ntp

Install wget Utility
yum install wget

Turn on NTP service
chkconfig ntpd on
service ntpd start


Set up passwordless SSH
ssh-keygen
cd .ssh
cp id_rsa /vagrant
cat id_rsa.pub >> authorized_keys

Setup Ambari
wget http://public-repo-1.hortonworks.com/ambari/centos6/1.x/updates/1.4.3.38/ambari.repo
cp ambari.repo /etc/yum.repos.d


Double check that repo was created
yum repolist

Install Ambari server
yum install ambari-server

Configure it (go with defaults)
ambari-server setup

Start Ambari Server
ambari-server start

Wait a little and you should be able to access your server at http://192.168.33.11:8080. Username and password: ambari/ambari. Follow the wizard which is self explanatory. In Install Options specify hostname of guest machine and then provide ssh private key by navigating to the hadoop_ambari folder that contains your Vagrantfile and id_rsa (remember when you copied your id_rsa file in guest OS to /vagrant folder?). In Customize Services, pick passwords for the services.

Wait for the installation to finish and enjoy your new set up! When browsing URLs inside of ambari, it by default would try to link to hostname and that won't work, so use the static ip instead. For example, MR2 JobHistory UI would be on http://192.168.33.11:19888.

Like always, comments? questions? just post!

Troubleshooting:

1.

If you can not get to the URLs, try to disable iptables
service iptables stop

Verify that curl is able to access the apache test page from inside the vm
vagrant ssh
curl -v localhost

If that doesn't work, then it's definitely not the port forwarding.

Lastly verify that the Host can access the page through curl
curl -v 'http://localhost:8080'

2.

Check if server is listening on 8080 and where it is binding
netstat -ntlp | grep 8080

Note that 127.0.0.1 is only accessible to the local machine, which for a guest machine means nothing.  Outside of the VM, it can't reach it! 0.0.0.0 is accessible from anywhere on the local network, which to a VM includes the host machine.

127.0.0.1 is normally the IP address assigned to the "loopback" or local-only interface. This is a "fake" network adapter that can only communicate within the same host. It's often used when you want a network-capable application to only serve clients on the same host. A process that is listening on 127.0.0.1 for connections will only receive local connections on that socket.

"localhost" is normally the hostname for the 127.0.0.1 IP address. It's usually set in /etc/hosts (or the Windows equivalent named "hosts" somewhere under %WINDIR%). You can use it just like any other hostname - try "ping localhost" to see how it resolves to 127.0.0.1.

0.0.0.0 has a couple of different meanings, but in this context, when a server is told to listen on 0.0.0.0 that means "listen on every available network interface". The loopback adapter with IP address 127.0.0.1 from the perspective of the server process looks just like any other network adapter on the machine, so a server told to listen on 0.0.0.0 will accept connections on that interface too.

Resources:

List of ports

  config.vm.network :forwarded_port, guest: 80, host: 42080, auto_correct: true #Apache http
  config.vm.network :forwarded_port, guest: 111, host: 42111, auto_correct: true #NFS portmap
  config.vm.network :forwarded_port, guest: 2223, host: 2223, auto_correct: true #Gateway node
  config.vm.network :forwarded_port, guest: 8000, host: 8000, auto_correct: true #Hue
  config.vm.network :forwarded_port, guest: 8020, host: 8020, auto_correct: true #Hdfs
  config.vm.network :forwarded_port, guest: 8042, host: 8042, auto_correct: true #NodeManager
  config.vm.network :forwarded_port, guest: 8050, host: 8050, auto_correct: true #Resource manager
  config.vm.network :forwarded_port, guest: 8080, host: 8080, auto_correct: true #Ambari
  config.vm.network :forwarded_port, guest: 8088, host: 8088, auto_correct: true #Yarn RM
  config.vm.network :forwarded_port, guest: 8443, host: 8443, auto_correct: true #Knox gateway
  config.vm.network :forwarded_port, guest: 8744, host: 8744, auto_correct: true #Storm UI
  config.vm.network :forwarded_port, guest: 8888, host: 8888, auto_correct: true #Tutorials
  config.vm.network :forwarded_port, guest: 10000, host: 10000, auto_correct: true #HiveServer2 thrift
  config.vm.network :forwarded_port, guest: 10001, host: 10001, auto_correct: true #HiveServer2 thrift http
  config.vm.network :forwarded_port, guest: 11000, host: 11000, auto_correct: true #Oozie
  config.vm.network :forwarded_port, guest: 15000, host: 15000, auto_correct: true #Falcon
  config.vm.network :forwarded_port, guest: 19888, host: 19888, auto_correct: true #Job history
  config.vm.network :forwarded_port, guest: 50070, host: 50070, auto_correct: true #WebHdfs
  config.vm.network :forwarded_port, guest: 50075, host: 50075, auto_correct: true #Datanode
  config.vm.network :forwarded_port, guest: 50111, host: 50111, auto_correct: true #WebHcat
  config.vm.network :forwarded_port, guest: 60080, host: 60080, auto_correct: true #WebHBase


References:

https://github.com/petro-rudenko/bigdata-toolbox/blob/master/Vagrantfile
http://serverfault.com/questions/513654/troubleshooting-why-1-vagrant-works-but-another-does-not
http://stackoverflow.com/questions/5984217/vagrants-port-forwarding-not-working
http://stackoverflow.com/questions/23840098/empty-reply-from-server-cant-connect-to-vagrant-vm-w-port-forwarding
http://stackoverflow.com/questions/20778771/what-is-the-difference-between-0-0-0-0-127-0-0-1-and-localhost


Thursday, November 13, 2014

How to enable backspace in vim on Mac OS

Create a file called ~/.vimrc and put the following lines in it.

set nocompatible
set backspace=indent,eol,start

ENJOY!

Monday, October 6, 2014

How to customize JA-SIG CAS authentication process

Some people see Central Authentication Service (CAS) as a black box that magically tells you if you are authenticated against certain accreditation or not... Configuration is dead simple. All you have to do is to specify chain of authentication mechanisms in /src/main/webapp/WEB-INF/deployerConfigContext.xml file. CAS would try your login credentials against each one and eventually would either fail or pass.

Today, I would like to lift some of this mystery out and tell you how to customize parts of JA-SIG CAS to fit your requirements.

Here is the scenario, you are trying to authenticate via CAC card (X509 certificate) and need additional validation after user keys in his PIN. Let's say that we need to verify that the user is a part of certain organization that is listed in his certificate.

Step 1:
Create new Maven Web Application project

Step 2:
Add CAS dependencies to pom.xml file

        <!-- Main guts of CAS -->
         <dependency>
            <groupId>org.jasig.cas</groupId>
            <artifactId>cas-server-webapp</artifactId>
            <version>${cas.version}</version>
            <type>war</type>
            <scope>runtime</scope>
        </dependency>

        <!-- Needed to interact with X509 certificates -->
        <dependency>
            <groupId>org.jasig.cas</groupId>     
            <artifactId>cas-server-support-x509</artifactId>     
            <version>${cas.version}</version>
        </dependency>

Step 3:
Clean and build the project. It would download all the dependencies for your project.

Step 4: 
Add following line under 
<bean id="authenticationManager" class="org.jasig.cas.authentication.AuthenticationManagerImpl"> 
    <property name="credentialsToPrincipalResolvers">
         <list>

in your /src/main/webapp/WEB-INF/deployerConfigContext.xml configuration file.

<bean  class=  "org.jasig.cas.adaptors.x509.authentication.principal.X509CertificateCredentialsToIdentifierPrincipalResolver">
</bean>

Per documentation, "This is the List of CredentialToPrincipalResolvers that identify what Principal is trying to authenticate. The AuthenticationManagerImpl considers them in order, finding a CredentialToPrincipalResolver which supports the presented credentials."

This would basically tell our CAS to invoke X509CertificateCredentialsToIdentifierPrincipalResolver

Step 5:
Add following line under
<bean id="authenticationManager" class="org.jasig.cas.authentication.AuthenticationManagerImpl"> 
    <property name="authenticationHandlers">
         <list>

in the same configuration file.

    <bean class="org.jasig.cas.adaptors.x509.authentication.handler.support.X509CredentialsAuthenticationHandler">
        <property name="trustedIssuerDnPattern" value=".*, OU=<replace it>, O=<replace it>, C=<replace it>" />
        <property name="subjectDnPattern"  value=".*, OU=<replace it>, O=<replace it>, C=<replace it>" />
    </bean>

Per documentation: "Whereas CredentialsToPrincipalResolvers identify who it is some Credentials might authenticate, AuthenticationHandlers actually authenticate credentials.  Here we declare the AuthenticationHandlers that authenticate the Principals that the CredentialsToPrincipalResolvers identified.  CAS will try these handlers in turn until it finds one that both supports the Credentials presented and succeeds in authenticating."

Step 6:
Let's review... We have a new project that has all CAS dependencies in it and is configured to authenticate against CAC card by using org.jasig.cas.adaptors.x509.authentication.handler.support.X509CredentialsAuthenticationHandler

Step 7.
All JA-SIG CAS is public! So don't be afraid to review it! Get the latest release via git or download specific release that you perhaps specified in the pom file of our project.
In our case we are interested in

  • org.jasig.cas.adaptors.x509.authentication.principal.X509CertificateCredentialsToIdentifierPrincipalResolver
  • org.jasig.cas.adaptors.x509.authentication.handler.support.X509CredentialsAuthenticationHandler

Step 8.
X509CertificateCredentialsToIdentifierPrincipalResolver - is pretty basic and does not contain an actual logic of authentication. Remember? "Whereas CredentialsToPrincipalResolvers identify who it is some Credentials might authenticate, AuthenticationHandlers actually authenticate credentials."
So let's look at X509CredentialsAuthenticationHandler

Step 9.
X509CredentialsAuthenticationHandler contains
protected final boolean doAuthentication(final Credentials credentials)
method that performs actual authentication and decides if user will be permitted to access the system or not. Here is an extract of the code that is self explanatory:
     
       if (valid && hasTrustedIssuer && clientCert != null) {
      x509Credentials.setCertificate(clientCert);
      this.log.info("Successfully authenticated " + credentials);
      return true;
       }
       this.log.info("Failed to authenticate " + credentials);
       return false;

Step 10.
So what if you were to asked to change the default behavior of X509CredentialsAuthenticationHandler in terms what it does to authenticate or if you were asked to extend it? Perhaps upon successful X509 authentication, you were required to check if specific user was a part of some group inside of LDAP? What to do?

Step 11.
In your Source Packages, create a new package that would be EXACTLY the same as X509CredentialsAuthenticationHandler so let's create org.jasig.cas.adaptors.x509.authentication.handler.support package.
Now, you need to add X509CredentialsAuthenticationHandler.java to this package, or you can rename it to something else to distinguish it from the "original" implementation. If you do decide to rename it, please make sure to update its name in /src/main/webapp/WEB-INF/deployerConfigContext.xml (Step 5).

Step 12.
Copy the source code of the X509CredentialsAuthenticationHandler and paste it into your new java class. Alter doAuthentication method to contact external LDAP server with extracted IssuerDN (or whatever) to check for specific group membership or any other requirement you might have.

Step 13.
Alter the last step where doAuthentication method returns authentication pass or fail flag (See step 9) to whatever you see fit your requirements.

Step 14.
Clean and Build again for changes to take effect.

Step 15.
Deploy generated cas.war file onto Tomcat or any other server, and try it out!
Please note, that to be able to generate cas.war after the build, you need to add

    <build>
        <plugins>
            <plugin>
                <artifactId>maven-war-plugin</artifactId>
                <configuration>
                    <warName>cas</warName>
                </configuration>
            </plugin>
        </plugins>
    </build>

to your pom.xml file.


Hopefully this was useful to you and you are not feel more comfortable working and modifying internals of CAS. Like always feel free to reach out to me with questions.

Wednesday, September 24, 2014

Apache Kafka. Set up. Writing to. Reading from. Monitoring. Part 4

Now that we have Kafka cluster up and running (Part 1 Part 2), and we are able to monitor it (Part 3), we need to learn how to write to and read from it by using Java.

I have created and uploaded my projects onto github so feel free to download the code and follow along. It is configured to work with IP addresses and topics that we created and configured in Part 1 and 2.

Producer code
First you need to specify connection information. This is as simple as specifying broker list IPs and ports.
// List of brokers that the producer will try to connect to
props.put("metadata.broker.list", "192.168.33.21:9092,192.168.33.22:9092");

Inside of properties you can set number of different choices and flags. Later you would use it to create ProducerConfig object that would in turn be used to create Producer object that would be able to send out messages to Kafka cluster.

Then select a topic that you want to write to
String topic = "my_test_topic" ;

Construct a message that would contain your topic, message and id and use Producer object to send it.

String msg = "Test message # " + 1 ;
KeyedMessage<String, String> data = new KeyedMessage<String, String>(topic, String.valueOf(1), msg);
producer.send(data);

Consumer code
This code is a little bit more complex and I had to use lots of tricks to make sure that I will be able to read from a topic of interest. Basically, if you were not careful with offsets, you would be able to read anything... I tried to comment the code as much as possible so that it would be self explanatory, but the best way to understand it all is by running it with debug and see the process flow.

Hope you enjoyed this start to end Kafka cluster guide and don't hesitate to reach out to me with comments or questions!

Apache Kafka. Set up. Writing to. Reading from. Monitoring. Part 3

Now that we were able to communicate with our Kafka cluster by writing to and reading from it, we might be curious what we have there. What brokers we have, what are the offsets on different topics, etc.

The best way to grasp the big picture is tool that can give you nice graphical interface that is lightweight. I was able to find and get KafkaOffsetMonitor working on my cluster.

The instructions on the website are pretty easy to follow along so I won't repeat them here. Main point of this point is to make reader aware of KafkaOffsetMonitor tool to give start to end hands on experience with Kafka.

Enjoy!

Friday, September 12, 2014

SVN to GIT Migration

You need to move your code from SVN to GIT. What do you need to do?

First of all, get yourself familiar with the process and what steps you would need to do: https://www.atlassian.com/pt/git/migration#!migration-overview. In this tutorial, I will use a svn2git tool to help me with migration, but svn2git is a wrapper of git svn clone, so all of the basics would still apply. Now you are wondering why svn2git? Well, when I was using git svn clone described in the above mentioned article, I ran into the issue where SVN had spaces in tags, and git replaced them with %20 and that broke things. Go figure. Here is the issue. So after some digging and trying to resolve it, I came across svn2git project that had a work around for this issue

Download handy svn migration scripts from https://bitbucket.org/atlassian/svn-migration-scripts/downloads. We would use it to generate authors.txt file. You can find more details here.

After you have authors.txt file in hand, let's go ahead and make sure that we can run svn2git. I am on Mac, for Debian-based system refer to the svn2git installation guide.
Run following commands to make sure that you have git-core, git-svn, ruby and rubygems installed on your system. You should have them if you have Xcode installed. If not, install it!
git --help
git svn --help
ruby --help
gem --help

With help of rubygems install svn2get. This would also add it to your PATH
sudo gem install svn2git

Create new directory where you want your converted files to be stored. This directory will become your new local git repository.
mkdir gitcode
cd gitcode
svn2git http://svn.repo.com/path/to/repo --authors /path/to/authors/authors.txt --verbose

Refer to the svn2git installation guide for more options. In my case, I received
'master' did not match any file(s) known to git.
error and had to tweak my command slightly to make it work. Like so,
svn2git http://svn.repo.com/path/to/repo --authors /path/to/authors/authors.txt --verbose --trunk / --nobranches --notags
Basically, my SVN was not properly set up and I had to manually specify trunk location, and there were not branches or tags.

Depending on how much source code you have it can take a while... when it is all done: review the code and push it to a remote repository where everyone will be able to access it.
git remote add origin ssh://server/path/to/repo
git push origin master

That's it!


Tuesday, September 9, 2014

Apache Kafka. Set up. Writing to. Reading from. Monitoring. Part 2

In Part 1, we create single machine that was running Kafka. Now let's do some horizontal scaling!

Step 1. Create new directory and initialize it with the box that we created in Part 1.
mkdir debianKafkaClusterNode2
cd debianKafkaClusterNode2
vagrant init debianKafkaClusterNode2 <path_to_the_box>/debian-kafka-cluster.box

Step 2. Edit generated Vagrant file (See Part 1 for details)
- Make sure that the memory is set to at least 2048
- Change the IP to be 192.168.33.11

Step 3. Start this box up and log in
vagrant up
vagrant ssh

Step 4. Configure Kafka.
Open $KAFKA_HOME/config/server.properties and set following values
broker.id=2
host.name=192.168.33.11

Now, repeat Steps 1-4 for number of boxes that you want to set up for your Kafka cluster. Don't forget to keep track of broker.id and IP (Step 2 and 4) - make sure they are unique!

After you successfully created n number of boxes, bring up your first Kafka cluster box that your created in Part 1. We shall refer to it as Node1
vagrant up
vagrant ssh

Start Zookeeper and Kafka on Node1
sudo $ZK_HOME/bin/zkServer.sh start
sudo $KAFKA_HOME/bin/kafka-server-start.sh $KAFKA_HOME/config/server.properties &

Start Kafka on rest of the nodes.
sudo $KAFKA_HOME/bin/kafka-server-start.sh $KAFKA_HOME/config/server.properties &

Congrats! You have Kafka cluster! Test it out by going to Node1 and adding few messages to the topic. Use Ctrl+C to exit.
$KAFKA_HOME/bin/kafka-console-producer.sh --broker-list 192.168.33.10:9092, 192.168.33.11:9092 --topic test-topic
this 
is

test

Test that you can retrieve the messages from some other node in the cluster
$KAFKA_HOME/bin/kafka-console-consumer.sh --zookeeper 192.168.33.10:2181 --topic test-topic --from-beginning

As you may have noticed, we use only one Zookeeper! To add more while still following majority rule, edit $KAFKA_HOME/config/server.properties by setting zookeeper.connect to the list of appropriate machines. This has to be done on each server. Don't forget to change $ZK_HOME/conf/zoo.cfg as well as myid. See Part 1 for more details. For example for 3 machine set up:
zoo.cfg file
server.1=192.168.33.10:2888:3888
server.2=192.168.33.11:2888:3888
server.3=192.168.33.12:2888:3888

echo "2" > /var/zookeeper/data/myid
echo "3" > /var/zookeeper/data/myid

Just to make sure that we have everything at this point, let's shut everything down and start it back up:
On each VM.
exit
vagrant halt

vagrant up
vagrant ssh

(Start Zookeeper and Kafka)
sudo $ZK_HOME/bin/zkServer.sh start
sudo $KAFKA_HOME/bin/kafka-server-start.sh $KAFKA_HOME/config/server.properties &

Use commands to add topics and messages and read them. Have fun!

Apache Kafka. Set up. Writing to. Reading from. Monitoring. Part 1

Phew! That was a mouth full... but, basically what I am going to try to do here is:
  1. Show you how to set up your own Apache Kafka cluster.
  2. Write to Apache Kafka and read from it using Kafka supplied shell scripts and then by using Java client.
  3. Finally, we quickly review KafkaOffsetMonitor - an app to monitor your Kafka consumers and their position (offset) in the queue.

First thing first... What is Apache Kafka? Straight from the source: "Apache Kafka is publish-subscribe messaging rethought as a distributed commit log." There are number of documents and guides out there that talk about the architecture and design, so I am not going to restate it here. What we want is some hands on experience with Kafka to test it out... in my case, it is much easier for me to learn things if I can play with them as I read about them.

In order to set up our cluster, let's use Vagrant to help us with the set up and configuration of VMs. This way, we can always reuse it one a different system and most importantly, we will be able to delete VM and start from scratch if we were to mess up without trying to break our heads if we removed something properly from the system or not.

If you never used Vagrant before, consider walking through Getting Started tutorial to truly appreciate it!

Anyway let's download VirtualBox and Vagrant and install them. Please follow installation guides...

Now, create a directory which would hold your VM instance and properly name it so that you could tell it apart from other VMs in the future.
In this case, we are going to use very basic debian since we won't need fancy GUI, etc.
 
mkdir debianKafkaClusterNode1
cd debianKafkaClusterNode1
vagrant init debianKafkaClusterNode1 http://puppet-vagrant-boxes.puppetlabs.com/debian-70rc1-x64-vbox4210.box 
 
After this we are going to have Vagrantfile that can be used to configure basic VM configurations like memory, network configuration, etc. That being said, let's bump up our memory to 2GB. Find and upcomment following lines and set memory to 2048 or however much you want to give to the box. In this tutorial, we are going to set up cluster of 3 machines, so we are going to need 2x3=6GB of memory only for VM, don't forget about your own host system ;)

  config.vm.provider "virtualbox" do |vb|
  #   # Don't boot with headless mode
  #   vb.gui = true
  #
  #   # Use VBoxManage to customize the VM. For example to change memory:
     vb.customize ["modifyvm", :id, "--memory", "2048"]
  end

Since we want for this VM to be able to communicate with other boxes and it might be a good idea to SSH to it from our host system, let's find config.vm.network in the Vagrantfile and uncomment it out. Here we are going to assign it IP: 192.168.33.10

  # Create a private network, which allows host-only access to the machine
  # using a specific IP.
  config.vm.network "private_network", ip: "192.168.33.10"

Now we are ready to start the box!
vagrant up
 
The very first time it might take sometime since Vagrant will attempt to download
debian-70rc1-x64-vbox4210.box from http://puppet-vagrant-boxes.puppetlabs.com/.

Now log into the box
vagrant ssh

And install java and text editor
sudo apt-get update
sudo apt-get install openjdk-8-jdk
sudo apt-get install vim
 
Now we are going to install Apache Kafka by downloading its source code and building it.
sudo su -
wget https://archive.apache.org/dist/kafka/kafka-0.8.0-beta1-src.tgz
mkdir /opt/kafka
tar -zxvf kafka-0.8.0-beta1-src.tgz
cd kafka-0.8.0-beta1-src
./sbt update
./sbt package
./sbt assembly-package-dependency
cd ../
mv kafka-0.8.0-beta1-src /opt/kafka

Install Zookeeper
wget http://apache.claz.org/zookeeper/zookeeper-3.4.6/zookeeper-3.4.6.tar.gz
mkdir /opt/zookeeper
tar -zxvf zookeeper-3.4.6.tar.gz --directory /opt/zookeeper
cp /opt/zookeeper/zookeeper-3.4.6/conf/zoo_sample.cfg /opt/zookeeper/zookeeper-3.4.6/conf/zoo.cfg

Configure Zookeeper by creating a directory for zookeeper data
mkdir -p /var/zookeeper/data

and specifying this directory in /opt/zookeeper/zookeeper-3.4.6/conf/zoo.cfg file
by editing dataDir property like so
dataDir=/var/zookeeper/data

In the same file add if not already there value for first zookeeper server. Specify IP of our newly created machine.
server.1=192.168.33.10:2888:3888

Specify myid so that the server would be able to identify itself in the zookeeper cluster
echo "1" > /var/zookeeper/data/myid

Configure Kafka
Edit server.properties files in /opt/kafka/kafka-0.8.0-beta1-src/config
Set following values by finding them in the above mentioned file and making sure they are uncommented as well
broker.id=1
host.name=192.168.33.10
zookeeper.connect=192.168.33.10:2181

It would be much easier to add Zookeeper and Kafka location to the PATH so we don't have to refer to it by the entire path, plus if you later decide to move them you won't have to change hardcoded path. To add them to your environmental variables create or edit if already exists .bash_profile file like so
vim ~/.bash_profile

add following entries to it
export ZK_HOME=/opt/zookeeper/zookeeper-3.4.6/
export KAFKA_HOME=/opt/kafka/kafka-0.8.0-beta1-src/
export PATH=$ZK_HOME/bin:$KAFKA_HOME/bin:$PATH

Make sure to close and open new terminal window for changes to take effect!

Start Zookeeper
sudo $ZK_HOME/bin/zkServer.sh start

Start Kafka
sudo $KAFKA_HOME/bin/kafka-server-start.sh $KAFKA_HOME/config/server.properties &

Test Kafka by listing available topics. At first, it should not have any:
$KAFKA_HOME/bin/kafka-list-topic.sh --zookeeper 192.168.33.10:2181

Test Kafka by creating a new topic
$KAFKA_HOME/bin/kafka-create-topic.sh --zookeeper 192.168.33.10:2181 --replica 1 --partition 1 --topic test-topic

Re-run command to list available topics. You should see test-topic in the list

Test Kafka by producing massages tot hat topic from the console. Use ctrl+c when finished.
$KAFKA_HOME/bin/kafka-console-producer.sh --broker-list 192.168.33.10:9092 --topic test-topic
This
is
Kafka
Test

Test Kafka consumer to verify that messages are there for that topic.
$KAFKA_HOME/bin/kafka-console-consumer.sh --zookeeper 192.168.33.10:2181 --topic test-topic --from-beginning

You should see
This
is
Kafka
Test

If you followed above test steps and everything worked as expected, it is time to package this box so that you can re-use it for our future boxes within cluster. On your host machine execute
VBoxManage list vms

You should see something like this:
"debian-cluster-node-1_default_1409266303013_22617" {3d996de2-94e1-4d72-be8f-29f36150ac84}

Use this name to package it up into a box.
vagrant package --base debian-cluster-node-1_default_1409266303013_22617 --output debian-kafka-cluster.box

Once Vagrant is done you should see debian-kafka-cluster.box in the same directory. Go ahead and shutdown the VM.
vagrant halt

In summary, we created a VM, installed all required software on it (java, zookeeper, kafka) and configured it to work within a cluster. Next we would have to duplicate our box into several machines so that we can have a Kafka cluster.

Friday, September 5, 2014

How to kill MR job

Recently, I needed to kill a job that I executed by mistake. What did I do?


If you are comfortable around Linux, steps are pretty much the same as killing any job. Find the job's pid and kill it... Let's see how you would do it in Hadoop environment:


First of all, I listed current running jobs in Hadoop by executing following command in the shell:


$ bin/hadoop job –list


The output would look something like this:


1 jobs currently running
JobId                  State          StartTime       UserName
job_201203293423_0001   1             1334506474312   krinkera


JobId is what we want.


Now use following command to kill it. Remember to substitute jobId with what you found in previous step.


$ bin/hadoop job -kill <jobId>


You should see confirmation that your job was indeed killed
Killed job job_201204011859_0002


Please note that it might take some time for UI to refresh with the new job status.

Friday, August 29, 2014

Apache Kafka Introduction : Should I use Kafka as a message broker?

Found this very good explanation of Kafka (see reference below). Thought I would repost it in case something were to happen to the original blog. Enjoy!
-----------------------------------------------------------------------------------------------------------------------------------

Asynchronous messaging is an important component of any distributed application. Producers and consumers of messages are de-coupled. Producers send messages to a queue or topic. Consumers consume messages from the queue or topic. The consumers do not have to be running when the message is sent. New consumers can be added on the fly. For Java programmers, JMS was and is the popular API for programming messaging applications. ActiveMQ, RabbitMQ , MQSeries (henceforth referred to as traditional brokers) are some of the popular message brokers that are widely used. While these brokers are very popular, they do have some limitations when it comes to internet scale applications. Generally their throughput will max out at few ten thousands of messages per second. Also, in many cases, the broker is a single point of failure.

A message broker is little bit like a database. It takes a message from a producer, stores it. Later a consumer reads the messages. The concepts involved in scaling a message broker are the same concepts as in scaling databases.  Databases are scaled by partitioning the data storage and we have seen that applied in Hadoop, HBASE, Cassandra and many other popular open source projects. Replication adds redundancy and failure tolerance.

A common use case in internet companies is that log messages from thousands of servers need to sent to other servers that do number crunching and analytics. The rate at which messages are produced and consumed is several thousands per sec, much higher than a typical enterprise application. This needs message brokers that can handle internet scale traffic.

Apache Kafka is a open source message broker that claims to support internet scale traffic. Some key highlights of Kafka are
  • Message broker is a cluster of brokers. So there is partitioning and no single point of failure.
  • Producers send messages to Topics.
  • Messages in a Topic are partitioned among brokers so that you are not limited by machine size.
    • For each topic partition 1 broker is a leader
    • leader handles reads and writes
    • followers replicate
  • For redundancy, partitions can be replicated.
  • A topic is like a log file with new messages appended to the end.
  • Messages are deleted after a configurable period of time. Unlike other messaging systems where message is deleted after it is consumed. Consumer can re-consume messages if necessary.
  • Each consumer maintains the position in the log file where it last read.
  • Point to point messaging is implemented using Consumer groups. Consumer groups is a set of consumers with the same groupid. Within a group, each message is delivered to only one member of the group.
  • Every message is delivered at least once to every consumer group. You can get publish subscribe using multiple consumer groups.
  • Ordering of messages is preserved per partition. Partition is assigned to consumer within a consumer group. If you have same number of partitions and consumers in a group, then each consumer is assigned one partition and will get messages from that partition in order.
  • Message delivery: For a producer , once a message is committed, it will be available as long as at least one replica is available. For the consumer, by default, Kafka provides at least once delivery, which means, in case of a crash, the message could be delivered multiple times. However with each consume, Kafka returns the offset in the logfile. The offset can be stored with the message consumed and in the event of a consumer crash, the consumer that takes over can start reading from the stored offset. For both producer and consumer, acknowledgement from broker is configurable.
  • Kafka uses zookeeper to store metadata.
  • Producer API is easy to use. There 2 consumer APIs.
  • High level API is the simple API to use when you don'nt want to manage read offset within the topic. ConsumerConnector is the consumer class in this API and it stores offsets in zookeeper.
  • What they call the Simple API is the hard to use API to be used when you want low level control of read offsets.
  • Relies on filesystem for storage and caching. Caching is file system page cache.
  • O(1) reads and writes since message and written to end of log and read sequentially. Reads and writes are batched for further efficiency.
  • Developed in Scala programming language
Apache Kafka can be downloaded at http://kafka.apache.org/downloads.html.

They have a good starter tutorial at http://kafka.apache.org/documentation.html#quickstart. So I will not repeat it. I will however write a future tutorial for JAVA producers and consumers.

Apache Kafka is a suitable choice for a messaging engine when
  • You have a very high volume of messages - several billion per day
  • You need high through put
  • You need the broker to be highly available
  • You need cross data center replication
  • You messages are logs from web servers
  • Some loss of messages is tolerable
Some concerns that you need to be aware of are
  • Compared to JMS, the APIs are low level and hard to use
  • APIs are not well documented. Documentation does not have javadocs
  • APIs are changing and the product is evolving
  • Default delivery is at least once delivery. Once and only once delivery requires additional work for the application developer
  • Application developer needs to understand lower level storage details like partitions and consumer read offsets within the partition
It is useful to remember history and draw an analogy with NoSQL databases. 3 or 4 years ago Nosql database were hot and people wanted to use them everywhere. Today we know that traditional RDBMS are not going anywhere and the NoSQL databases are suitable for some specialized use cases. In fact NoSQL database are going in the direction of additing features that are available in RDBMSs. Kafka today is where NoSql databases were a few years ago. Don'nt throw away your traditional message broker yet. While Kafka will be great for the cases mentioned above, lot of the simpler messaging use cases can be done lot more easily  with a traditional message broker. 

Resource: http://khangaonkar.blogspot.com/2014/04/apache-kafka-introduction-should-i-use.html

Thursday, August 28, 2014

Getting Twitter data using Python.

A lot of times developers need sample Twitter test data for their apps. Twitter data is used for trending, for analysis of sentiment, etc.

Instead of using some old file with few tweets or registering for some service to give you the data, why not to get the data yourself? It is very easy with Python script that uses Tweepy, a Python library that supports Twitter API.

First of all install Python. I am on MacOS so python was already installed for me. Please refer to this guide that goes in more details about the set up.

Next you need IDE to write your Python script(s). Personally, I use TextWrangler like it was suggested by Dr. Chuck.

Install Tweepy using HomeBrew
  $ brew search pip
  $ sudo easy_install pip
  $ sudo pip install tweepy

Register with Dev Twitter to get your tokens, etc.
Go to https://dev.twitter.com/, sign-in to twitter ( create an account if you don't already have one)
    Click the profile Icon ( top left) -> My Applications -> Create New App
    Provide the necessary data and it will create an application.
    Go to the application -> click on API Keys tab
    This will show you the necessary keys to authenticate your application using OAuth.

Now you are ready to write your script that would query for a phase "Big Data" and would store first 100 results for you in csv file along with the date of the tweet.

#!/usr/bin/python
import tweepy
import csv #Import csv
auth = tweepy.auth.OAuthHandler('XXX', 'XXX')
auth.set_access_token('XX-XXX', 'XXX')

api = tweepy.API(auth)

query = 'Big Data'
max_tweets = 100
# Query for 100 twits that have Big Data in them and store it in a list
searched_tweets = [status for status in tweepy.Cursor(api.search, q=query).items(max_tweets)]
# Print entire object
print searched_tweets

# Open/Create a file to append data
csvFile = open('result.csv', 'a')
#Use csv Writer
csvWriter = csv.writer(csvFile)
counter = 0

for tweet in tweepy.Cursor(api.search,
                    q=query,
                    lang="en").items(max_tweets):
    #Write a row to the csv file. Use utf-8 since twits might have special characters
    csvWriter.writerow([tweet.created_at, tweet.text.encode('utf-8')])
    print tweet.created_at, tweet.text
csvFile.close()

You can examine entire tweeter object that being returned and pull more data if you like by iterating through searched_tweets and pulling each element.

Please refer to this blog post if you want to see Java version of the same concept. 

References:
http://www.pythonlearn.com/install.php
http://sachithdhanushka.blogspot.com/2014/02/mining-twitter-data-using-python.html
http://stackoverflow.com/questions/22469713/managing-tweepy-api-search

Thursday, August 21, 2014

Temporarily Disable Puppet

Every now and then you need to disable puppet on a box to quickly test something and to avoid the situation where puppet would overwrite your changes.


Here is what you do:


# puppet agent --disable "Reason why disabled"


Now when you are done, make sure to re-enable it again


# puppet agent --enable

Saturday, August 16, 2014

How to create SolrCloud Instance.

In this post, I decided to talk about how to quickly get SolrCloud instance up and running on your local box.

First of all, make sure that you have Java 6+ installed on your system.
$ java -version
java version "1.7.0_25"
Java(TM) SE Runtime Environment (build 1.7.0_25-b15)

Java HotSpot(TM) 64-Bit Server VM (build 23.25-b01, mixed mode)

Download most recent version of Solr from http://lucene.apache.org/solr/. If you are on Unix, Linux or Mac OS, grab tgz file. Download it somewhere where you would have permissions to untar it and to run it. I downloaded and decompressed it under my home directory in /opt/solr by running:

tar solr-<version>.tgz

In this example, I am going to be using default jetty server, which was proven to scale even on large production systems and since I don't want to further complicate this example. If you were to google "sold jetty vs tomcat", you would see tons of opinions out there on which one to use. In my opinion, use whatever makes more sense in your case.

To run very basic Solr instance, all you have to do is to navigate to example folder and to run start.jar like so

$ cd opt/solr/example/
$ java -jar start.jar

However, we are interested in SolrCloud Instance in this case... so let's create two shards with replication of 2. For detailed discussion of shards, replication and SolrCloud in general please visit SolrCloud wiki.

Copy example directory and name it node1. After that rename collection name to something more useful, like wikipedia. Remove any data that might be there. And do some autodiscovery magic.

$ cp -r example/ node1/
$ cd node1
$ cp -r solr/collection1/ solr/wikipedia
$ rm -rf solr/wikipedia/data/
$ find . -name "core.properties" -type f -exec rm {} \;
$ echo "name=wikipedia" > solr/wikipedia/core.properties

Now you are ready to start your first node in your SolrCloud
$ java -Dcollection.configName=wikipedia -DzkRun -DnumShards=2 -Dbootstrap_confdir=./solr/wikipedia/conf/ -jar start.jar 


Now let's create 3 more nodes and start them to complete our SolrCloud Instance

$ cp -r node1/ node2/
$ cd node2/
$ rm -rf solr/wikipedia/conf/
$ java -DzkHost=localhost:9983 -Djetty.port=8984 -jar start.jar 

$ cp -r node1/ node3/
$ cd node3/
$ rm -rf solr/wikipedia/conf/
$ java -DzkHost=localhost:9983 -Djetty.port=8985 -jar start.jar 

$ cp -r node1/ node4/
$ cd node4/
$ rm -rf solr/wikipedia/conf/
$ java -DzkHost=localhost:9983 -Djetty.port=8986 -jar start.jar 


Since all of our configuration files are now managed by Zookeeper, we would need to download them, then modify them and upload them back... yes, I know it is a pain, but this way you don't have to do it manually on each server, just do it once, upload it to Zookeeper and it would take care of the rest for you!

Navigate to /opt/solr/node1/scripts/cloud-scripts directory and run following command

$ ./zkcli.sh -zkhost localhost:9983 -cmd downconfig -confdir /<directory_of_your_choice>/solr_conf -confname wikipedia

Navigate to the directory and you should see all of the configuration files.
$ ls
_schema_analysis_stopwords_english.json elevate.xml solrconfig.xml
_schema_analysis_synonyms_english.json lang spellings.txt
admin-extra.html mapping-FoldToASCII.txt stopwords.txt
admin-extra.menu-bottom.html mapping-ISOLatin1Accent.txt synonyms.txt
admin-extra.menu-top.html protwords.txt update-script.js
clustering schema.xml velocity
currency.xml scripts.conf xslt

Make changes (usually to schema.xmla nd to solrconfig.xml) and upload it back by running similar command.

$ ./zkcli.sh -zkhost localhost:9983 -cmd upconfig -confdir /<directory_of_your_choice>/solr_conf -confname wikipedia

That's it!

Wednesday, August 13, 2014

Accumulo: How to creat a new table and set permissions

Creating a new table in Accumulo is pretty easy. It is as simple as


createtable my_new_cool_table


Now let's say that you create this table as a root. How can you check if another user will be able to read or write to this table? Let's say that you have user bob, how can you check what this user sees or can do?


Run following command
userpermissions -u bob


You should see a list of tables and current user authorization on a particular table


userpermissions -u bob
System permissions: System.CREATE_TABLE, System.DROP_TABLE, System.SYSTEM
Table permissions (!METADATA): Table.READ
Table permissions (META): Table.READ, Table.WRITE


The new table is not in the list since user bob can't do anything with the table that was created by root. Let's change that! In order for user bob to be able to read from new table, execute this command


grant Table.READ -t my_new_cool_table -u bob


If you were to re-execute userpermissions command, you would see


userpermissions -u bob
System permissions: System.CREATE_TABLE, System.DROP_TABLE, System.SYSTEM
Table permissions (!METADATA): Table.READ
Table permissions (META): Table.READ, Table.WRITE
Table permissions (my_new_cool_table): Table.READ


Full list of authorizations:
Table.ALTER_TABLE  
Table.BULK_IMPORT  
Table.DROP_TABLE   
Table.GRANT        
Table.READ         
Table.WRITE

Thursday, July 31, 2014

What is Overseer in SolrCloud

This is by far the best and to the point explanation that I was able to find. Credit to Mark Miller.

The Overseer isn't mentioned much because it's an implementation
detail that the user doesn't have to really consider.

The Overseer first came about to handle writing the clusterstate.json
file, as a suggestion by Ted Dunning.

Originally, each node would try and update the custerstate.json file
themselves - and use optimistic locking and retries.

We decided that a cleaner method was to have an overseer and let new
nodes register themselves and their latest state as part of a list -
the Overseer then watches this list, and when things change, publishes
a new clusterstate.json - no optimistic locking and retries needed.
All the other nodes watch clusterstate.json and are notified to
re-read it when it changes.

Since, the Overseer has picked up a few other duties when it makes
sense. For example, it handles the shard assignments if a user does
not specify them. It also does the work for the collections api -
eventually this will be beneficial in that it will use a distributed
work queue and be able to resume operations that fail before
completing.

I think over time, there are lots of useful applications for the Overseer.

He is elected in the same manner as a leader for a shard - if the
Overseer goes down, someone simply takes his place.

I don't think the Overseer is going away any time soon.

- Mark

Wednesday, June 18, 2014

How to enable unicast on Ganglia

To configure unicast you should designate one machine to be receiver. Receiver's gmond.conf should look like this

globals {
  daemonize = yes
  setuid = yes
  user = nobody
  debug_level = 0
  max_udp_msg_len = 1472
  mute = no
  deaf = no
  allow_extra_data = yes
  host_dmax = 86400 /* Remove host from UI after it hasn't report for a day */
  cleanup_threshold = 300 /*secs */
  gexec = no
  send_metadata_interval = 30 /*secs */
}

cluster {
  name = "Production"
  owner = "unspecified"
  latlong = "unspecified"
  url = "unspecified"
}

host {
  location = "unspecified"
}

udp_send_channel {
  host = ip.add.ress.here
  port = 8649
  ttl = 1
}
udp_recv_channel { 
  port = 8649
}

tcp_accept_channel {
  port = 8649
}
 
.....
 
On all the other machines you will need to configure only this
globals {
  daemonize = yes
  setuid = yes
  user = nobody
  debug_level = 0
  max_udp_msg_len = 1472
  mute = no
  deaf = yes
  allow_extra_data = yes
  host_dmax = 86400 /* Remove host from UI after it hasn't report for a day */
  cleanup_threshold = 300 /*secs */
  gexec = no
  send_metadata_interval = 30 /*secs */
}

cluster {
  name = "Production"
  owner = "unspecified"
  latlong = "unspecified"
  url = "unspecified"
}

host {
  location = "unspecified"
}

udp_send_channel {
  host = ip.add.ress.here
  port = 8649
  ttl = 1
}
...
 
Please notice that send_metadata_interval is set to 30 (seconds). Metrics in Ganglia are sent separately from it's metadata. Metadata contains information like metric group, type etc. In case you restart receiving gmond metadata will be lost and gmond will not know what to do with the metric data and it will be discarded. This may result in blank graphs. In multicast mode gmonds can talk to each other and will ask for metadata if it's missing. This is not possible in unicast mode thus you need to instruct gmond to periodically send metadata.

Now in your gmetad.conf put
# /etc/gmetad.conf on ip.add.ress.here
data_source "Production" ip.add.ress.here
...
 
Now restart everything...

Tuesday, June 10, 2014

CSS!!!

Pretty cool

http://css3please.com/

Nagios Set up


How To Install Nagios On CentOS 6

Step 1 - Install Packages on Monitoring Server

rpm -Uvh http://dl.fedoraproject.org/pub/epel/6/x86_64/epel-release-6-8.noarch.rpm
rpm -Uvh http://rpms.famillecollet.com/enterprise/remi-release-6.rpm
yum -y install nagios nagios-plugins-all nagios-plugins-nrpe nrpe php httpd
chkconfig httpd on && chkconfig nagios on
service httpd start && service nagios start


We should also enable SWAP memory on this droplet, at least 2GB:

dd if=/dev/zero of=/swap bs=1024 count=2097152
mkswap /swap && chown root. /swap && chmod 0600 /swap && swapon /swap
echo /swap swap swap defaults 0 0 >> /etc/fstab
echo vm.swappiness = 0 >> /etc/sysctl.conf && sysctl -p


Step 2 - Set Password Protection


Set Nagios Admin Panel Password:
htpasswd -c /etc/nagios/passwd nagiosadmin


Make sure to keep this username as "nagiosadmin" - otherwise you would have to change /etc/nagios/cgi.cfg and redefine authorized admin.

Now you can navigate over to your droplet's IP address http://IP/nagios and login.

You will be prompted for password you set in Step 2:


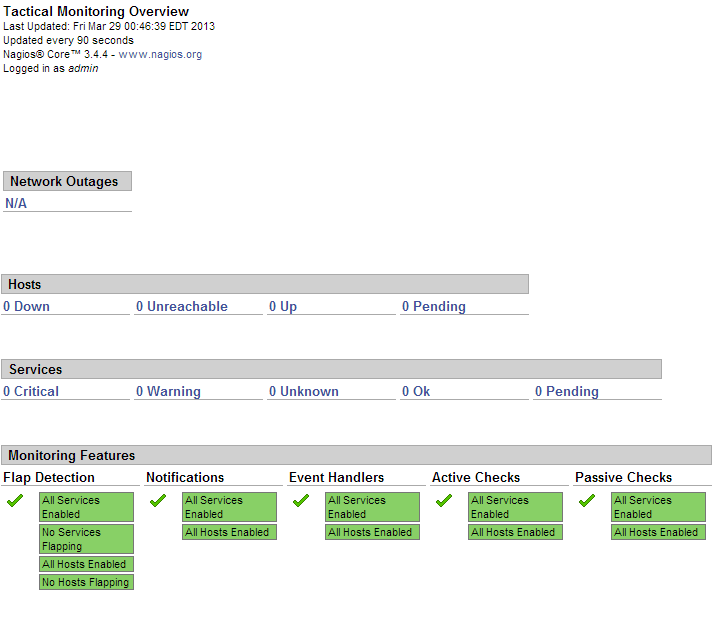
This is what the Nagios admin panel looks like:


Since this is a fresh installation, we don't have any hosts currently being monitored.


Now we should add our hosts that will be monitored by Nagios. For example, we will use cloudmail.tk (198.211.107.218) and emailocean.tk (198.211.112.99).

From public ports, we can monitor ping, any open ports such as webserver, e-mail server, etc.

For internal services that are listening on localhost, such as MySQL, memcached, system services, we will need to use NRPE.

Step 4 - Install NRPE on Clients


rpm -Uvh http://dl.fedoraproject.org/pub/epel/6/x86_64/epel-release-6-8.noarch.rpm
rpm -Uvh http://rpms.famillecollet.com/enterprise/remi-release-6.rpm
yum -y install nagios nagios-plugins-all nrpe
chkconfig nrpe on


This next step is where you get to specify any manual commands that Monitoring server can send via NRPE to these client hosts.

Make sure to change allowed_hosts to your own values.

Edit /etc/nagios/nrpe.cfg

log_facility=daemon
pid_file=/var/run/nrpe/nrpe.pid
server_port=5666
nrpe_user=nrpe
nrpe_group=nrpe
allowed_hosts=198.211.117.251
dont_blame_nrpe=1
debug=0
command_timeout=60
connection_timeout=300
include_dir=/etc/nrpe.d/
command[check_users]=/usr/lib64/nagios/plugins/check_users -w 5 -c 10
command[check_load]=/usr/lib64/nagios/plugins/check_load -w 15,10,5 -c 30,25,20
command[check_disk]=/usr/lib64/nagios/plugins/check_disk -w 20% -c 10% -p /dev/vda
command[check_zombie_procs]=/usr/lib64/nagios/plugins/check_procs -w 5 -c 10 -s Z
command[check_total_procs]=/usr/lib64/nagios/plugins/check_procs -w 150 -c 200
command[check_procs]=/usr/lib64/nagios/plugins/check_procs -w $ARG1$ -c $ARG2$ -s $ARG3$


Note:

In check_disk above, the partition being checked is /dev/vda - make sure your droplet has the same partition by running df -h /

You can also modify when to trigger warnings or critical alerts - above configuration sets Warning at 20% free disk space remaining, and Critical alert at 10% free space remaining.


We should also setup firewall rules to allow connections from our Monitoring server to those clients and drop everyone else:

iptables -N NRPE
iptables -I INPUT -s 0/0 -p tcp --dport 5666 -j NRPE
iptables -I NRPE -s 198.211.117.251 -j ACCEPT
iptables -A NRPE -s 0/0 -j DROP
/etc/init.d/iptables save


Now you can start NRPE on all of your client hosts:
service nrpe start


Step 5 - Add Server Configurations on Monitoring Server


Back on our Monitoring server, we will have to create config files for each of our client servers:
echo "cfg_dir=/etc/nagios/servers" >> /etc/nagios/nagios.cfg
cd /etc/nagios/servers
touch cloudmail.tk.cfg
touch emailocean.tk.cfg


Edit each client's configuration file and define which services you would like monitored.

nano /etc/nagios/servers/cloudmail.tk.cfg


Add the following lines:

define host {
        use                     linux-server
        host_name               cloudmail.tk
        alias                   cloudmail.tk
        address                 198.211.107.218
        }

define service {
        use                             generic-service
        host_name                       cloudmail.tk
        service_description             PING
        check_command                   check_ping!100.0,20%!500.0,60%
        }

define service {
        use                             generic-service
        host_name                       cloudmail.tk
        service_description             SSH
        check_command                   check_ssh
        notifications_enabled           0
        }

define service {
        use                             generic-service
        host_name                       cloudmail.tk
        service_description             Current Load
        check_command                   check_local_load!5.0,4.0,3.0!10.0,6.0,4.0
        }
You can add more services to be monitored as desired. Same configuration should be added for second client, emailocean.tk, with different IP address and host_name:

This is a snippet of /etc/nagios/servers/emailocean.tk.cfg:
define host {
        use                     linux-server
        host_name               emailocean.tk
        alias                   emailocean.tk
        address                 198.211.112.99
        }

...


You can add additional clients to be monitored as /etc/nagios/servers/AnotherHostName.cfg

Finally, after you are done adding all the client configurations, you should set folder permissions correctly and restart Nagios on your Monitoring Server:

chown -R nagios. /etc/nagios
service nagios restart


Step 6 - Monitor Hosts in Nagios


Navigate over to your Monitoring Server's IP address http://IP/nagios and enter password set in Step 2.

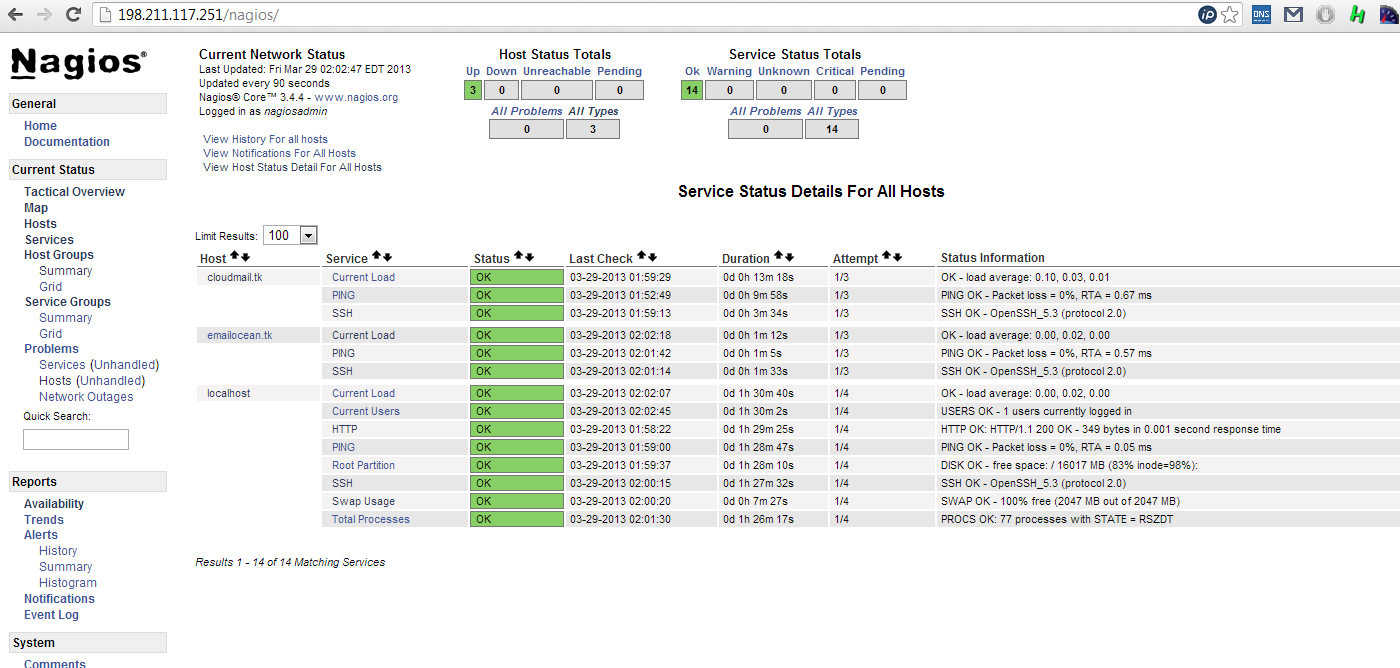
Now you should be able to see all the hosts and services:


And you are all done! 
---------------- EXAMPLE -------------
rpm -Uvh http://dl.fedoraproject.org/pub/epel/6/x86_64/epel-release-6-8.noarch.rpm

rpm -Uvh http://rpms.famillecollet.com/enterprise/remi-release-6.rpm

yum -y install nagios nagios-plugins-all nrpe

chkconfig nrpe on

vim /etc/nagios/nrpe.cfg

        allowed_hosts=<ip_address>

service nrpe start


--------------------------------- SERVER -------------------------

rpm -Uvh http://dl.fedoraproject.org/pub/epel/6/x86_64/epel-release-6-8.noarch.rpm

rpm -Uvh http://rpms.famillecollet.com/enterprise/remi-release-6.rpm

yum -y install nagios nagios-plugins-all nagios-plugins-nrpe nrpe php httpd

chkconfig httpd on && chkconfig nagios on

service httpd status/start

service nagios start

htpasswd -c /etc/nagios/passwd nagiosadmin

vim /etc/nagios/nrpe.cfg

service nrpe start

echo "cfg_dir=/etc/nagios/servers" >> /etc/nagios/nagios.cfg

cd /etc/nagios/

mkdir servers

cd servers/

touch 113.tk.cfg

vim 113.tk.cfg

chown -R nagios. /etc/nagios

service nagios restart