Sunday, March 27, 2016

More of a rant vs a post

Just one thing to make things easy for you when trying to find out a list of java processes on your box is getting rid of redundant 'grep' command that is looking for 'java' process

so instead of listing all processes running and looking for 'java' one 

ps aex | grep java

use this!

ps aex | grep -v "grep" | grep java

Saturday, March 19, 2016

All About That Bayes!!!

If you were to search on Bayes, you will see tons of hits on the subject. It often comes up in discussions of data science and machine learning. The iconic post can be found in Yudkowsky article (the article is long, but worth reading if you need to learn very fine details about Bayes)

So why another article on Bayes? Well, as they say that you truly learn when you teach, so instead of glancing over pages explaining Bayes, I decided to put together what I know of Bayes to get it all organized here and in my head!

I believe one of the best examples to explain Bayes is breast cancer testing test. It is simple to follow when explained and it is easy to get wrong in the first glance.

Let's say that over the years, doctors were able to observe following data:
- 1% of women have breast cancer.
- 95% of mammograms are able to detect cancer when it is indeed there.
- 20% of mammograms detect "false" cancer, i.e. it is NOT there!

At this point, you can put this information into probability table to make it visually clear to you which value represents what.


How to read this table? If we go column by column, we have:
- First column lists the result of the test, it either showed that it was positive for cancer or not.
- Second and third columns shows condition of the patient. 2nd - for patients that unfortunately have cancer and 3rd - column is for patients who are cancer free.
- The second column shows that test will correctly return positive result for 95% of patients who truly have cancer and 5% of the time it would show that test is negative even though patient does have cancer.
- The third column shows that test will incorrectly return positive result for 20% of the patients who actually cancer free, while giving negative result for 80% of cancer free patients.

Now the question is: Given above information, what are actual chances of someone who just received unfortunate news of positive breast cancer to actually have breast cancer? Would you jump to conclusion that it is very likely considering the fact that the test is able to provide 95% of test positive accuracy when cancer is present? 99.99% since it is just your luck? Or 0% since bad stuff can't happen to you? Well, read on for more educated guess.

Let's look at the table to see how bad the news is...
Step 1: Result is Breast Cancer Positive - refer to Breast Cancer Positive row to find out percentages for patients with cancer and without.
Step 2: Calculate TRUE POSITIVE: Chance of patient having cancer X Chance of positive test = 1% X 95% = 0.0095
Step 3: Calculate FALSE POSITIVE: Chance of patient not having cancer X Chance of positive test = 99% X 20% = 0.198

or if you want to populate confusion matrix entirely:


So when one is given the unfortunate news of breast cancer test being positive, to calculate the probability of patient actually having cancer, one needs to divide probability of true positive (i.e. patient does have cancer) by total probability of patient getting positive breast cancer test back, which is sum of True Positive and False Positive. Let's do some arithmetic!

True Positive = 0.0095
True Positive + False Positive = 0.0095 + 0.198 = 0.2075

Hence actual chance of someone having breast cancer given positive breast cancer test is
0.0095 / 0.2075 = 0.04578 or 4.578%

4.578% - Feeling better about that outcome? But how can it be so low? Doesn't test predict with 95% accuracy? Yes, but it also incorrectly predicts healthy people having cancer 20% or 1 in 5. Given that this cancer only occurs in 1% of the people, it is for more likely that 99% of population who is healthy tested positive. Let's explain with actual numbers to make it clear. In a room of 100 people, only 1 person will have breast cancer. If all 100 were given breast cancer test, 1 person with cancer would receive very accurate test (95%) indicating that they better get some treatment quickly. On the other hand, out of 99 remaining healthy people, 99 X 20% = 19.8 (or almost 20) would receive inaccurate news of them having cancer. So only 1 out of 21 (20+1) people tested positive will actually have cancer!

To make this point hit home for 'visual' learners, let's draw some circles!

Area A - 1% of entire population has cancer


So if you were to ask what's the probability of randomly picking someone with breast cancer, you would come out with

Formula 1:
P(A) = | A | / | Entire Population |

Area B - People who receive positive breast cancer test results (both true positive and false positive)

Similarly, probability that someone would have positive breast cancer results are

Formula 2:
P(B) = | B | / | Entire Population |

Now let's merge these two figures into one:

The intersection of A and B, noted as AB, means that a person who has cancer was diagnosed to have cancer, true positive in our earlier example.

The probability of this is:

Formula 3:
P(AB) = | AB | / | Entire Population |

Now let's answer the same question as we had before: Given the news of positive breast cancer exam, what are the chances of cancer actually be present?

Since we are using regions to help us, we can paraphrase it as, what are the changes for someone who is in region B (i.e. positive breast cancer test) to be in region AB (i.e. positive breast cancer test for a person who is in region A and is having a cancer.) or simply the probability of A given B:

Formula 4:
P(A | B) = | AB | / | B |

if we recall formulas 2 and 3, we can rewrite formula 4 as

Formula 5:
P(A | B) = P(AB) / P (B)

While we know P (B) - number of all positive tests, we don't know P (AB)... So let's ask another question. Given that randomly selected person who has breast cancer, what are the chances that test is positive? (We actually know that number! 95%!!!). This can be written as

Formula 6:
P (B | A) = P(AB) / P(A)

we can express the unknown P(AB) as P(AB) = P(B | A) x P (A) and substitute it in formula 5

Formula 7:
P (A | B) = P(B | A) x P (A) / P (B)

In this case, we know

P (B | A) = 0.95
P (A) = 0.01
P (B) = 0.0095 + 0.198 = 0.2075

P (A | B) = 0.95  * 0.01 / 0.2075 = 0.04578 or 4.578%

and... what we derived in Formula 7 is Bayes' theorem!

I always found that if you can quickly derive the formula, you would always be able to have it at hand versus trying to memorize it and guess A's and B's location. So next time, when some one ask you about Bayes, draw two circles and take it from there!

Monday, March 7, 2016

Making git respect .gitignore after the fact!

Imagine the situation where you wrote your code and then decided to add it to your git repo. Pretty easy right?

git init
git add .


Before you commit, you want to see what's going to be committed. So you do

git status

Now you see whole bunch of config and target files that have no business being in the repo. Not a problem, you can use .gitignore right? First remove what you added, create .gitignore file and you can re add again only source files.

git rm -r .

create .gitignore with
/target/**
.settings/**
.classpath
.project

and re-add

git add .

Check what's about to be committed... and what?!?!? old files? How can this be? Did I messed up my regex? spelled gitignore wrong or forgot the leading period? Nope, everything seems correct...

After reading gitignore help guide... you need to clear your cache!!! Here is what you do
Instead of running

git rm -r .

Run this
git rm -r --cached .

cached flag is the key difference.

After this command, re-add, verify and finally commit:

git add .
git commit -m "source files only!!!"

Monday, February 1, 2016

Kafka Fun

In this post, I will show you how to set up Kafka locally via three brokers and how to get Producer and Consumer going.

Installation


First of all, download Kafka from http://kafka.apache.org/downloads.html.
(Make sure to download binary version, not the source!)

I chose to go with version 8 only because I rather avoid x.0 version of Kafka 9.0. Nothing in my experience works well when it is x.0 version. I only work with x.1 and above :) (j.k. of course)

Download it into directory of your choice and untar it

tar xzf kafka_2.11-0.8.2.1.tgz

Create log directories for three brokers


Now since we will be creating three brokers on the same machine, we need to create three separate log directories in order to avoid these three to be overwriting each other logs.

Als-MacBook-Pro:kafka alkrinker$ mkdir broker-1-log
Als-MacBook-Pro:kafka alkrinker$ mkdir broker-2-log
Als-MacBook-Pro:kafka alkrinker$ mkdir broker-3-log

Start zookeeper


Kafka requires zookeeper. Conveniently enough, Kafka comes with its own version of zookeeper. This version of the zookeeper is not meant for production, more for test and demo. Let's start it.

cd kafka_2.11-0.8.2.1/
bin/zookeeper-server-start.sh config/zookeeper.properties &

Check if zookeeper is running

ps -ef | grep zookeeper

You should see something like that

Als-MacBook-Pro:kafka_2.11-0.8.2.1 alkrinker$ ps -ef | grep zookeeper
  501   849   596   0  5:49PM ttys000    0:00.55 /Library/Java/JavaVirtualMachines/jdk1.8.0_25.jdk/Contents/Home/bin/java -Xmx512M -Xms512M -server -XX:+UseParNewGC /kafka
......
/kafka_2.11-0.8.2.1/bin/../core/build/libs/kafka_2.10*.jar org.apache.zookeeper.server.quorum.QuorumPeerMain config/zookeeper.properties


Up to this point, we started built in zookeeper with default property file and created three log directories for each broker

Configure brokers


Each broker would require its own configuration file in order to run. Once again, Kafka comes with default configuration file located in

config/server.properties

Let's copy this file three times for each broker so we can have something like

config/server1.properties
config/server2.properties
config/server3.properties

Open server1.properties and change following properties to provided values
--- server 1 ---
broker.id=1
port=9091
log.dirs=/Users/alkrinker/Documents/Projects/kafka/broker-1-log

--- server 2 ---
broker.id=2
port=9092
log.dirs=/Users/alkrinker/Documents/Projects/kafka/broker-2-log

--- server 3 ---
broker.id=3
port=9093
log.dirs=/Users/alkrinker/Documents/Projects/kafka/broker-3-log

Start brokers


Time to start your brokers!
$ bin/kafka-server-start.sh config/server1.properties &
$ bin/kafka-server-start.sh config/server2.properties &
$ bin/kafka-server-start.sh config/server3.properties &


Use grep kafka to make sure you have 3 brokers started (plus zookeeper)
Output should look something like that
Als-MacBook-Pro:Installation Files alkrinker$ ps -ef | grep kafka
  501   849   596   0  5:49PM ttys000    0:04.40 /Library/Java/JavaVirtualMachines/jdk1.8.0_25.jdk/Contents/Home/bin/java -Xmx512M -Xms512M -server -XX:+UseParNewGC 

...........
org.apache.zookeeper.server.quorum.QuorumPeerMain config/zookeeper.properties


 501   969   596   0  8:44PM ttys000    0:02.20 /Library/Java/JavaVirtualMachines/jdk1.8.0_25.jdk/Contents/Home/bin/java -Xmx1G -Xms1G -server -XX:+UseParNewGC 
.......
/kafka/kafka_2.11-0.8.2.1/bin/../libs/zkclient-0.3.jar:/Users/alkrinker/Documents/Projects/kafka/kafka_2.11-0.8.2.1/bin/../libs/zookeeper-3.4.6.jar:/Users/alkrinker/Documents/Projects/kafka/kafka_2.11-0.8.2.1/bin/../core/build/libs/kafka_2.10*.jar kafka.Kafka config/server1.properties
  

501   975   596   0  8:44PM ttys000    0:01.68 /Library/Java/JavaVirtualMachines/jdk1.8.0_25.jdk/Contents/Home/bin/java -Xmx1G -Xms1G -server -XX:+UseParNewGC 
.......
/kafka/kafka_2.11-0.8.2.1/bin/../libs/zkclient-0.3.jar:/Users/alkrinker/Documents/Projects/kafka/kafka_2.11-0.8.2.1/bin/../libs/zookeeper-3.4.6.jar:/Users/alkrinker/Documents/Projects/kafka/kafka_2.11-0.8.2.1/bin/../core/build/libs/kafka_2.10*.jar kafka.Kafka config/server2.properties

  501   978   596   0  8:44PM ttys000    0:01.61 /Library/Java/JavaVirtualMachines/jdk1.8.0_25.jdk/Contents/Home/bin/java -Xmx1G -Xms1G -server -XX:+UseParNewGC 

......

/kafka/kafka_2.11-0.8.2.1/bin/../libs/snappy-java-1.1.1.6.jar:/Users/alkrinker/Documents/Projects/kafka/kafka_2.11-0.8.2.1/bin/../libs/zkclient-0.3.jar:/Users/alkrinker/Documents/Projects/kafka/kafka_2.11-0.8.2.1/bin/../libs/zookeeper-3.4.6.jar:/Users/alkrinker/Documents/Projects/kafka/kafka_2.11-0.8.2.1/bin/../core/build/libs/kafka_2.10*.jar kafka.Kafka config/server3.properties


 501   984   826   0  8:45PM ttys002    0:00.00 grep kafka


Create topic


(See man page for kafka-topics.sh for more details and all available options)

$ bin/kafka-topics.sh --zookeeper localhost:2181 --create --topic krinker --partitions 3 --replication-factor 3

Let's go over this line
--zookeeper localhost:2181
first we specify where is our zookeeper. We are using the default zookeeper here
--create --topic krinker
creates topic called krinker
--partitions 3 --replication-factor 3
since we have 3 brokers we can safely do 3 partitions with replication factor of 3. Note that we cant specify more than 3 here since we have only 3 brokers

After it let's what what we created


$ bin/kafka-topics.sh --zookeeper localhost:2181 --describe --topic krinker

Topic:krinker    PartitionCount:3    ReplicationFactor:3    Configs:
    Topic: krinker    Partition: 0    Leader: 1    Replicas: 1,2,3    Isr: 1,2,3
    Topic: krinker    Partition: 1    Leader: 2    Replicas: 2,3,1    Isr: 2,3,1
    Topic: krinker    Partition: 2    Leader: 3    Replicas: 3,1,2    Isr: 3,1,2


Start Producer


Let's start producer on broker 1
$ bin/kafka-console-producer.sh --broker-list localhost:9091 --topic krinker

Start Consumer


And let's start consumer to be able to read what our producer would write to topic krinker

$ bin/kafka-console-consumer.sh --zookeeper localhost:2181 --topic krinker

See it in Action!


Now go back to the terminal where you started your producer and type whatever you like

Hello World


Now go to the consumer window and you shall see Hello World displayed there.


Shut it down


$ bin/kafka-server-stop.sh config/server1.properties
$ bin/kafka-server-stop.sh config/server2.properties
$ bin/kafka-server-stop.sh config/server3.properties
$ bin/zookeeper-server-stop.sh config/zookeeper.properties

Verify
$ ps aux | grep kafka
alkrinker        1115   0.0  0.0  2432784    628 s000  S+    9:30PM   0:00.00 grep kafka

Sunday, January 31, 2016

Coursera Offline

A lot of good classes on coursera for free these days! Love that site.

Now, it is all good, but what if you are traveling and don't have reliable internet connection or no connection at all and you still want to watch the videos?

Of course, you can download videos by hand, but it is a pain.

I found this useful github project that can help you
https://github.com/coursera-dl/coursera

You need python 3 and pip 3 (I tried to do it with python 2 and it choked. plus the author of plugin strongly encourages to use python 3 due to encryption, etc)

Steps to get these files on Ubuntu OS
0. Update!
apt-get update

1. Install python 3 - if you are using Ubuntu 14.04, you already have it.

2. Install pip 3
apt-get install python3-pip

3. Per instructions (here) install coursera plugin
pip3 install coursera

4. Per instructions (here) supply your username and password as well as the course that you want to download
coursera-dl -u <user_name> -p <password> <course_name>

5. After some time you will see folder <course_name> with all videos and lecture notes broken down per section.

Enjoy studying off line!


Tuesday, January 19, 2016

Will it snow?

Being that it is January and that I have Macklemore concert in Richmond to go to this Friday, I am naturally curious if it will snow this Friday making my ~1.5h drive to Richmond potentially 3h+ drive... Yes, I looked up the weather predictions at Weather Underground(WU), the best weather forecast site in my opinion, but how do I know if it is accurate... or can I do better?

In order to predict weather for this Friday, I will employ simple Machine Learning technique!

It is very simple...
First you would need to collect the data. For this purpose I will return to WU site to collect year worth of data. Like I said, the site is awesome. Not only they are pretty accurate in their predictions, at least for my area, but they also have some cool gadgets and they share their data for free!

Now... The data won't be clean and what we will get from WU won't be immediately usable. From what I mentioned in one of my previous posts: one of the skills with working with data is to be able to clean it. There are numerous examples out there where dirty aka noisy data led to errors, either unintentional or not. So, second step would involve cleaning of the data.

Now that we have data, we will be able to use decision tree classifier to come up with the model. When we are satisfied with the model, we will be able to use it to come up with our own prediction for this weekend and compare the results with WU and then wait and see who was right :)

The Plan

Step 1

Data that will be given to us by WU will consist of several different features and the outcome for that day. For example, we will have the information of what happened that day. Did it snow? Was it nice and sunny? Or was it raining cats and dogs? I.e. we will have the outcome! As far as features go: we will have information about temperature, humidity, wind, etc. All of these together would help us to predict the weather: if it is 80 degrees and visibility is sunny - it is unlikely that it would snow, but most likely that it will be a nice weather to enjoy the outside on a beach! Hence our goal here is to gather features or attributes of the day that would help us determine the outcome of that day: snow, rain, etc.

Step 2

Clean it!

Step 3

Use Decision Tree to come up with model. For example, let's says that we have temperature of more than 80 degrees and we see historically that it never rained or snow when it was above 80 degrees, then one branch of the decision tree would be condition: if temp > 80 then "No Snow", what happens if it is less than 80? Well, we can look at other attributes that we will gather, let's say that if it was less than 80 degrees but more than 30 and outlook was sunny, it never snowed. Here you have yet another condition! If 30 < temp < 80 ad outlook is sunny then "No Snow". Hopefully, you can see the idea and where we are going with this at this point!
For step 3 to make things easier, I am going to use Weka. It is a machine learning software written in Java.

The Action

Now let's get some data!

Go to http://www.wunderground.com/
On the menu locate 'More' and select 'Historical Weather' submenu.
Enter zip code. In my case, I entered 23220 since I am trying to predict weather in Richmond this Friday! And hit 'Enter'
Locate Custom tab (Daily, Weekly, Monthly, Custom) and select year worth of data.


Select Get History. Then go all the way to the bottom to be able to download comma delimited file


I downloaded my file as richmond_data.csv and saved it on my laptop...

Ever since I migrated to MacOS, I started to favor Google Docs. For one thing, I don't want to learn Mac Office and then have to deal with converting my docs and excel spreadsheets for PC users... Finally, with Google Docs my documents are already in the cloud, hence less stuff to back up and worry about it.
Go to https://drive.google.com/ and create a new google sheets document.
File->Import and import your file (richmond_data.csv).
For import action, pick 'Import New Sheet(s)', for separator character, go ahead and pick comma. Hit Import and you shall see something like:


Now it is time to clean!!!


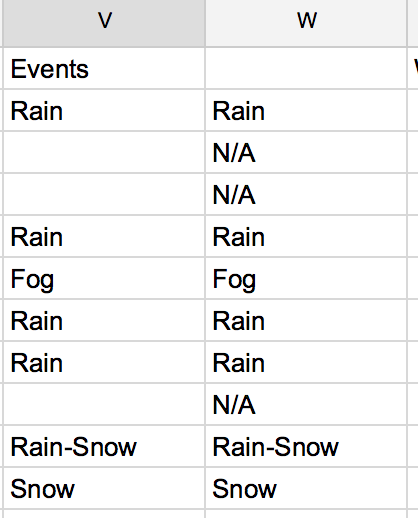
So we have a bunch of attributes and accompanied event for that day. Take a look at the last column: 'Event'. It contains what actually happened that day and as you can see some of the values are empty. Let's correct that and put 'N/A'. Instead of filling it out by hand, let's employ some of the excel wizardly. Create a new column right after 'Event' column and insert following formula (In my case, my 'Event' column is in V column):

=if(V2="","N/A",V2)

Basically, it does simple check to see if value is empty, if so, insert "N/A", if not put the original value in. Now drag it to the bottom and you shall have no empty values left at this point.


Now, we see that we can further improve the 'Event' column. As you can see we are given, multiple events in one column and ('Rain-Snow') and others are little value to us ('Fog' - I don't care if it will be foggy, I have anti fog lights on!!! :) ). So let's modify our formula to give us Snow or N/A.

=if(isnumber(find("Snow", V2)),"Snow","N/A")


Now let's swap 'Events' column with our clean column. You copy W column and paste is as values only and delete V column. Simple!

More cleaning: Precipitation column contains numeric value and T. Let's change it to 0 not to throw our model into a panic mode. Follow the same steps as above but with a slightly different formula, and after you are come copy/paste the values and delete old column.

=if(T2="T",0,V2)

Now, we will be predicting the weather! so we should not put the answer on the same line as list of attributes, i.e. we can not post the weather for that day along with the same day events. We will be predicting it, so we need to put tomorrow's weather in the same row as today's attributes. Select V3 cell and copy all the way to the bottom thus selecting all values for the weather. Now go to V2 and paste it over. So here, you have list of attributes and weather event that happened the next day. 

(Just glancing over the data it snowed like 6 times entire year! felt more than that probably since snow was never cleaned even that it only snowed so few times... VDOT... what can I say...)

At this point we have a relatively clean data, so let's download it locally so we can feed it to Weka and do some magic with it. File-> Download As->Comma separated values. (Can't go wrong with this format)

Let's model it!!!


Start Weka and pick 'Explorer' option.
Select 'Open file...' . Pick CSV as your type and navigate to the location of your downloaded file.


If you look at the EST column, you will see that it has 366 unique values. Makes sense since we see each day of the year here. This will not be useful to us so let's remove this column. (Select the checkbox next to it and click Remove button).

Select 'Classify' tab.
Select 'Choose' and pick J48 under trees submenu
Under 'More Options' select Events since that's what we are going to try to predict.
Hit Start


After few seconds, you shall have your decision tree!!!

Now all that hard work of trying to come up with attributes/features that would help you determine what will happen tomorrow was already done for you! Here you can create either your own weather app or just look at the temp and say that if it was less than 32 degrees and cloudcover was more than zero it would snow.
As you can tell, the tree is not very big... but we were expecting it since it only snowed some few times in the last year.

Scroll in the window to see more interesting stuff like confusion matrix and so on. If you take stats, you can use Weka to double check your results :)


As far as Richmond trip goes, if temperature will be less than 32 (it will be...) and we will have clouds the night before, it will snow. We shall see!!!

Sunday, December 20, 2015

Accessing wired Windows printer from your Mac

Before my PC seized to be, I used to have old wired printer that did the job... the only problem was that I already have few Apple laptops and I wanted to be able to print from them (The problem is easily solved by buying wireless printer that supports AirPrint, i.e. even print from your iPhone!).

Anyway, if you have wired Windows printer and don't want to upgrade just yet here is what you need to do:

On Windows PC
1. Establish user account on your PC. This was one thing that I had to do to make everything that should work to actually work. This is as easy as opening your control panel and clicking on Add user in your Users menu. For more tricks see this: http://www.howtogeek.com/howto/10325/manage-user-accounts-in-windows-home-server/

2. Now onto actual set up... Select Start->Devices and Printers. Right click on the printer that you want to share, and either pick share or properties and then pick sharing tab. Make sure that share check box is selected and make sure that you note down the name of the printer.

3. Open command prompt. Use ipconfig command to find your PC's IP.

To summarize this part. You have IP address and name of the printer to connect to and you have the credentials that you created in step 1.

On MAC
1. Open System Preferences and locate Printers and Scanners icon. Click!
2. Select + under printers to add new printer, i.e. wired Windows printer.
3. Right click on the menu and select Customize Toolbar and add Advanced
4. Click on Advanced. For type select Windows printer via spoolss
5. For URL provide IP and printer name that you have... so the link looks like smb://192.138.1.13/printer_name (Replace any spaces with %20 in your
6. Under Choose a driver or Printer Model pick your printer type (I did not see my exact model so I picked closes HP model instead. Worked)
7. At this point your PC printer will be connected to your Mac.

Testing
Select something to print on your Mac... in my case, the first time it tried to print it asked for my PC username/password which we created previously, after that it was stored in my keychain and was never an issue again.

That's it! Hope it helps and once again, let me know if you have further questions, etc.